San Antonio Real Estate Market Update: Sales Surge While Prices Adjust (Late March 2026)
 The San Antonio real estate market continues to evolve dramatically as spring activity accelerates into late March 2026, with recent weekly data from LERA MLS® showing a remarkable increase in home sales volume paired with noticeable pricing adjustments that create distinct strategic implications for homeowners making decisions about buying a home in San Antonio or selling a home in San Antonio. The final week of March demonstrated a striking 151-home volume surge to 633 closings, representing one of the highest single-week totals in recent San Antonio market history, while simultaneously showing $26,455 median price decline and $45,366 average price decrease.
This particular combination of surging volume with declining pricing represents a specific market pattern that differs fundamentally from typical spring acceleration where volume and pricing both increase together. Tami Price, REALTOR®, notes that when weekly closings jump 31% while prices moderate substantially, this pattern typically signals major inventory composition shift toward entry-level and mid-range properties closing in heavy concentration rather than indicating market-wide value depreciation or concerning demand weakness. Understanding what drives these dramatic week-to-week variations prevents reactive strategic decisions based on statistical patterns that reflect closing timing and inventory mix rather than genuine market transformation requiring immediate response from all buyers and sellers across San Antonio, Schertz, Cibolo, Helotes, Converse, and Boerne.
Why This Matters for San Antonio Home Buyers and Sellers
Understanding the relationship between volume surges and pricing adjustments provides critical intelligence about inventory composition, market segmentation, and strategic positioning that monthly summaries completely obscure. When 633 homes close compared to 482 the prior week while median prices drop $26,455 and average prices decline $45,366, these changes reveal specific patterns about which price segments dominated weekly activity rather than indicating uniform market appreciation or depreciation.
For buyers, recognizing that pricing decreases often reflect composition shifts toward affordable segments rather than genuine value deterioration prevents unrealistic expectations about sustained price declines creating buying windows that may not persist. The 633-home week likely included heavy representation from entry-level closings below $280,000 pulling statistical medians downward while individual property values remained stable.
For sellers, understanding that the prior week's elevated pricing reflected temporary luxury concentration rather than new baseline market values prevents disappointment when subsequent weeks show normalization. More importantly, the 633-home volume surge confirms robust buyer demand exists consistently across all segments, providing opportunity for properly positioned properties despite weekly statistical fluctuations.
The late March pattern demonstrates exceptionally strong spring market function where transaction volume reaches levels indicating healthy, active conditions while pricing metrics fluctuate based on normal segment rotation through closing processes rather than directional momentum requiring urgent strategic adjustment.
What Did the Week of March 16 Through March 22, 2026, Show?
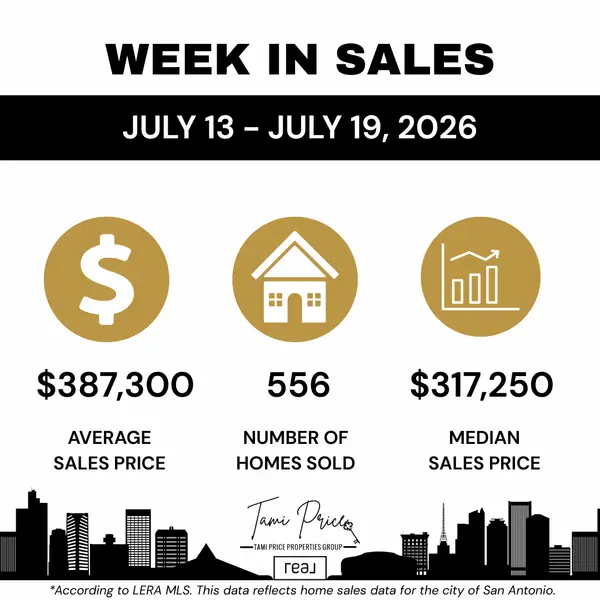
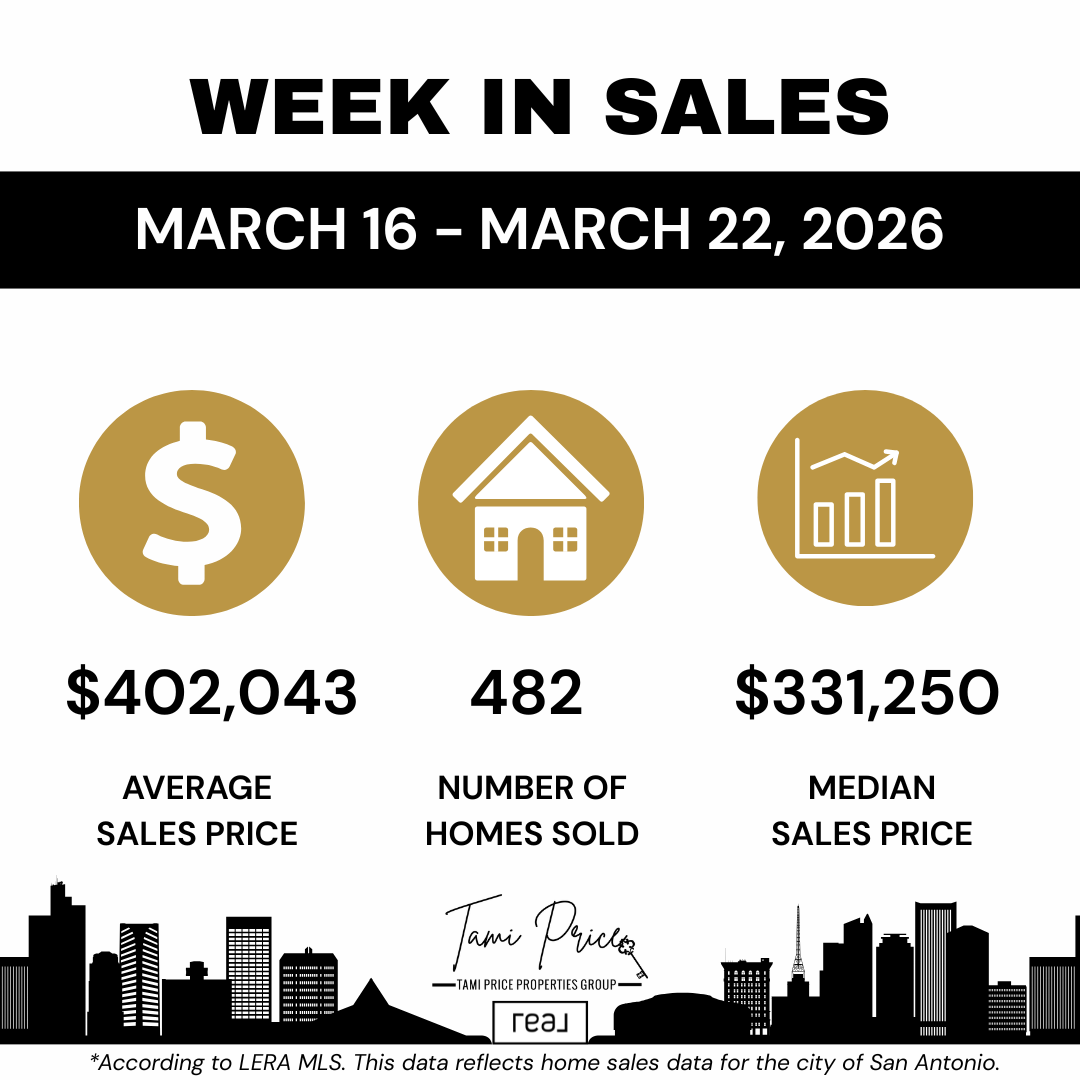
During the week of March 16 through March 22, 2026, San Antonio recorded 482 homes sold according to LERA MLS® data. The average sales price reached $402,043, while the median sales price came in at $331,250.
This week reflected strong spring activity with elevated pricing metrics across several characteristics:
- 482 total closed transactions indicate robust spring buyer engagement
- Average price of $402,043 represents elevated level suggesting luxury concentration
- Median price of $331,250 shows center of market activity in upper-mid-range
- The $70,793 gap between average and median indicates significant high-end representation
- Volume and pricing both positioned above historical spring baseline ranges
This mid-to-late March week established context for evaluating the subsequent week's dramatic shift. The 482-home volume represented solid spring activity without indicating exceptional acceleration beyond normal seasonal patterns. The median price of $331,250 positioned the center of market activity in upper-mid-range segments, meaningfully above the typical $300,000 to $320,000 range where San Antonio's market center historically sits.
The average price exceeding $402,000 suggested that higher-priced homes represented larger share of total weekly closings than typical distribution patterns. This elevated pricing across both median and average metrics created baseline against which the following week's changes become analytically significant.
For buyers and sellers making decisions during this period, market conditions appeared to show continued spring momentum with strong pricing support across segments. The elevated metrics might have created optimistic expectations about achievable values or raised concerns about rapidly appreciating markets pricing out budget-conscious buyers.
Q: Does $402,043 average sales price mean the typical San Antonio home costs over $400,000? A: No. The median of $331,250 shows that half of all sales occurred below that figure, meaning most homes sold well below $400,000. The high average indicates luxury sales pulling the metric upward. When average exceeds median by $70,000+, high-priced outliers are skewing the average substantially above where most transaction activity actually occurs.
What Did the Week of March 23 Through March 29, 2026, Reveal?
The following week showed extraordinary volume surge with dramatic pricing adjustments that demonstrate classic inventory composition rebalancing. During the week of March 23 through March 29, 2026, San Antonio recorded 633 homes sold, representing one of the highest single-week totals in recent market tracking.
This week's data demonstrates several striking patterns:
- 633 total sales representing a massive 151-home increase from the prior week
- Average sales price declining to $356,677, a $45,366 decrease from $402,043
- Median sales price moderating to $304,795, a $26,455 decrease from $331,250
- 31% volume increase combined with 11% average price decrease and 8% median decrease
- The $51,882 gap between average and median narrowing from prior week's $70,793
The most notable and analytically significant shift is the sharp increase in closed sales, rising from 482 homes to 633 homes in just one week. This level of activity reflects exceptional buyer demand, robust market function, and increased transaction movement across the San Antonio housing market in all price ranges and diverse neighborhoods.
At the same time, both the average and median sales prices moved meaningfully lower week over week. The average price decreased by more than $45,000, while the median price dropped by over $26,000. This simultaneous volume surge with pricing decline represents a specific pattern that requires professional interpretation to extract strategic meaning.
Q: Does the $26,455 median price drop signal a market crash or correction beginning? A: No. This reflects composition rebalancing where entry-level and mid-range homes comprised larger share of weekly closings. When 633 homes close with heavy representation below $280,000 compared to 482 homes with heavier upper-range concentration, medians naturally decline even when individual property values remain stable. This is composition effect, not value depreciation requiring reactive strategic response.
Understanding Volume Surges with Pricing Adjustments
The late March pattern where volume surges dramatically while pricing declines substantially represents inventory composition rebalancing that occurs regularly in active markets. The prior week's 482 closings with elevated pricing likely included above-average luxury and upper-mid-range representation. The current week's 633 closings likely included heavy entry-level and mid-range concentration.
This type of movement does not necessarily indicate a declining market, deteriorating conditions, or concerning demand weakness. Instead, it often reflects changes in the mix of homes reaching closing based on when contracts were signed weeks earlier and which price segments happened to concentrate during specific timeframes.
For example, when increased closing activity occurs disproportionately in entry-level and mid-range price points below $300,000, this concentration brings overall median and average statistics downward even as demand remains strong, transaction volume surges, and individual property values hold stable or appreciate modestly across all segments.
What Does This Combination of Volume Surge and Price Decline Signal?
When transaction volume increases dramatically by 31% while both median and average prices decline by 8% and 11% respectively in the same week, this specific pattern provides important signals about inventory composition, market segmentation, and strategic positioning requirements that differ fundamentally from patterns where volume and pricing move in the same direction.
The late March combination of 151 additional closings with $26,455 median decrease and $45,366 average decrease suggests several important market characteristics:
- Heavy concentration of entry-level and mid-range closings during the 633-home week
- Composition rebalancing after prior week's elevated luxury representation
- Robust buyer demand across all segments demonstrated by exceptional total volume
- Normal market function where different price tiers rotate through closing timing
- Healthy spring market activity without concerning directional deterioration
This pattern indicates that spring momentum continues building with strong underlying demand across all price segments rather than signaling value deterioration or buyer retreat. When volume surges while pricing moderates, the explanation lies in which specific homes happened to close during each particular week rather than in market-wide value changes.
Professional analysis recognizes that 633 closings in one week represents exceptional, healthy market function. The pricing adjustment simply reflects that more of those 633 closings occurred in affordable segments compared to the prior week's distribution. Neither week indicates what individual homes in specific neighborhoods are worth or how buyers and sellers should position particular properties.
Working with Tami Price, REALTOR®, buyers and sellers receive interpretation of these volume and pricing patterns within proper context, distinguishing composition effects from genuine trends while maintaining focus on neighborhood-specific comparable sales analysis that grounds individual transaction strategy.
What Does This Data Mean for San Antonio Home Buyers?
For buyers watching the San Antonio market and evaluating purchase timing and strategy, the late March volume surge with pricing adjustment creates several distinct considerations. The $26,455 median decline and $45,366 average decrease might initially suggest improving affordability and reduced competition creating buying opportunities.
However, proper analysis reveals that the 633-home volume surge indicates intensified overall market activity with more buyers successfully closing transactions simultaneously across all price segments. The pricing adjustment reflects which specific homes closed during that week rather than market-wide value deterioration creating improved leverage for buyers.
This shift can create opportunities for strategic buyers in several ways:
- More homes closing overall indicates robust inventory flow and market function
- Heavy entry-level and mid-range activity confirms consistent affordable segment demand
- Buyers may have more options across diverse neighborhoods and property types
- Certain segments may offer improved selection without indicating reduced competition
- Pricing variability across weeks reinforces importance of property-specific value analysis
With more homes selling and broader range of price points represented during the 633-home week, buyers benefit from confirmation that market functions effectively across all segments. However, competition still exists intensely, especially for homes that are priced accurately based on recent comparable sales and located in desirable neighborhoods with strong schools, convenient commutes, and established amenities.
Preparation and timing remain critically important during high-volume spring weeks. The 633-home surge indicates many buyers successfully navigated competitive processes, cleared contingencies, and reached closing. Buyers hoping to join that group need strong pre-approval, clear criteria, realistic expectations, and decisive action capability.
Q: Should buyers make lower offers now that median prices dropped $26,455? A: No. Offers should be based on comparable sales for specific properties in specific neighborhoods, not citywide median changes. If recent comparable sales in your target neighborhood show homes selling at 98% of list price, competitive offers remain necessary regardless of weekly median fluctuations. The median drop reflects composition, not an invitation for lowball offers disconnected from property-specific value analysis.
Comprehensive guidance on the home buying process in San Antonio from experienced REALTOR® representation helps buyers distinguish composition-driven statistical variations from genuine market shifts while maintaining focus on comparable sales analysis driving successful outcomes.
What Does This Data Signal for San Antonio Home Sellers?
For sellers contemplating listing properties or currently on market seeking offers, the late March volume surge to 633 closings provides exceptionally positive confirmation that buyer demand exists robustly across all price ranges and neighborhoods. Increased sales volume represents one of the most important positive indicators for sellers because it demonstrates that buyers are active, transactions are closing at healthy pace, and market function remains strong.
That said, the pricing adjustment reinforces that strategic positioning through accurate comparable sales-based pricing remains critically important regardless of overall market activity levels. A higher number of total transactions does not automatically translate into pricing power for individual sellers if their specific properties are positioned above market value for their neighborhoods and segments.
Today's buyers remain informed, conduct thorough research, and compare homes carefully across available alternatives before making purchase decisions. Sellers benefit from this robust market activity by focusing on:
- Pricing based on current comparable sales from past 30-60 days in specific neighborhoods
- Preparing homes to meet or exceed buyer expectations through repairs, cleaning, and staging
- Understanding how their specific properties fit within current competitive inventory
- Marketing timing and intensity appropriate for current activity levels and competition
- Responsive adjustment when showing feedback indicates positioning misalignment
The 633-home surge confirms buyers exist in large numbers actively closing transactions. The pricing adjustment confirms those buyers maintain value discipline and reject overpriced inventory regardless of overall activity levels. This combination creates optimal conditions for sellers who position correctly while creating challenges for those pricing optimistically above comparable sales support.
Tami Price's comprehensive approach to pricing your San Antonio home incorporates weekly volume monitoring as positive indicator while grounding actual pricing recommendations in neighborhood-specific comparable sales analysis ensuring alignment with current buyer value expectations.
Q: Does the 633-home volume week mean sellers can price higher than recent comparable sales? A: No. High volume with declining prices indicates robust activity concentrated in affordable segments where buyers maintain strict value discipline. Sellers gain pricing leverage when volume increases with rising prices and declining inventory, creating genuine competition and scarcity. Current pattern shows volume without price support, meaning accurate comparable sales-based pricing remains essential.
Capturing Spring Volume Surge Through Strategic Positioning
The 633-home closing week demonstrates that exceptional buyer engagement exists across the San Antonio market. Sellers who position properties correctly through accurate pricing, excellent preparation, and professional marketing can capture disproportionate attention from this large, active buyer pool.
However, volume alone does not guarantee individual success. Among the 633 closings, properties that sold were those positioned competitively based on comparable sales, presented in excellent condition, and marketed effectively to qualified buyers. Properties that remain on market despite exceptional activity levels suffer from positioning problems requiring analysis and correction.
Comprehensive pre-listing consultation evaluating current volume trends as context, pricing based on comparable sales, and property-specific positioning provides foundation for successful spring listing strategy.
How Should Weekly Volume and Pricing Variations Be Interpreted?
Weekly housing data provides valuable real-time snapshots of market activity, but late March's dramatic variations demonstrate why professional interpretation matters more than raw statistics. The 151-home volume surge combined with substantial pricing decreases creates apparent contradictions that require understanding of inventory composition effects and closing timing dynamics.
Because real estate transactions close weeks after contracts are signed following inspection periods, appraisal completion, financing approval, and title work, any particular week's closing composition reflects contract activity and market conditions from 30-60 days earlier. This timing lag means dramatic week-to-week changes often indicate which segments concentrated during specific periods rather than sudden market transformation.
Professional market analysis integrates multiple analytical approaches to extract meaningful intelligence:
- Weekly data reveals short-term composition effects, volume trends, and segment activity
- Multi-week patterns distinguish genuine momentum from single-week anomalies
- Monthly aggregates provide statistical stability reducing composition noise
- Neighborhood-specific comparable sales ground individual strategy in relevant data
- Seasonal pattern recognition contextualizes whether variations fall within normal ranges
The late March 633-home surge represents exceptional but not unprecedented spring activity level. Similar volume spikes occur periodically when builder closings cluster, contract timing concentrates, or seasonal acceleration peaks. The pricing adjustment represents normal composition rebalancing rather than concerning market deterioration.
Understanding these dynamics prevents reactive decisions like rushed purchases fearing continued price declines or discouraged listing withdrawals expecting market collapse based on single-week statistical variations lacking predictive value for individual transaction outcomes.
For military families managing PCS moves under compressed timelines, understanding both volume trends indicating market health and comparable sales indicating property-specific value helps inform decisions balancing urgency with protection. Working with REALTOR® representation holding Military Relocation Professional designation ensures proper data interpretation.
How Does Tami Price, REALTOR®, Guide Clients Through Volume Surges and Price Adjustments?
Tami Price, REALTOR®, tracks real-time housing trends across San Antonio to guide clients through changing market conditions and dramatic weekly variations like late March's volume surge with pricing adjustment. Weekly data provides clearer pictures of short-term momentum and composition effects beyond monthly averages that obscure important patterns.
This recent increase in sales activity combined with pricing adjustments highlights a market that is exceptionally active but segmented by price tier. Different segments perform differently based on inventory flow, buyer pools, and seasonal timing, making it essential to understand nuances rather than applying uniform interpretations across all contexts.
For buyers, guidance emphasizes:
- Understanding that volume surges indicate healthy market function, not deterioration
- Recognizing pricing adjustments often reflect composition rather than value depreciation
- Focusing on comparable sales in target neighborhoods rather than citywide statistics
- Maintaining competitive readiness for well-priced properties during high-activity periods
- Avoiding unrealistic expectations about sustained price declines creating extended buying windows
For sellers, strategy focuses on:
- Viewing volume surges as positive indicators of buyer engagement and market health
- Pricing based on comparable sales rather than optimistic or pessimistic weekly statistics
- Understanding that high volume requires competitive positioning to capture attention
- Preparation and presentation creating differentiation during high-inventory periods
- Responsive adjustment if market feedback indicates positioning problems
Whether buying or selling, understanding how weekly variations reflect composition effects versus genuine trends helps position clients for better results. Late March's 633-home surge with pricing adjustment demonstrates robust spring market function rather than concerning deterioration or irrational acceleration requiring reactive strategic response.
This commitment to accurate data interpretation serves clients across all segments, from first-time home buyers to move-up buyers to sellers exploring new construction alternatives with builder incentives.
Expert Insight from Tami Price
With nearly two decades representing San Antonio buyers and sellers and approximately 1,000 closed transactions across multiple market cycles, Tami Price, REALTOR®, understands that late March's 633-home surge with substantial pricing adjustment represents exceptional spring market activity with normal composition rebalancing rather than concerning market deterioration requiring reactive strategic response.
"The late March data tells a story about robust spring market function that gets missed when people focus only on pricing decreases without understanding volume context," Tami explains. "Yes, the median dropped $26,455 and average fell $45,366. But 633 homes closed in one week. That's exceptional, healthy activity indicating strong buyer demand across all segments. The pricing adjustment simply reflects that more of those 633 closings happened in entry-level and mid-range segments compared to the prior week's heavier luxury concentration."
Tami holds multiple designations including Pricing Strategy Advisor (PSA), Seller Representative Specialist (SRS), Accredited Buyer's Representative (ABR), Graduate REALTOR® Institute (GRI), and Military Relocation Professional (MRP). These certifications reflect ongoing education in pricing methodology, market analysis, statistical interpretation, and specialized service for military families.
Her experience analyzing weekly data across multiple spring seasons provides perspective preventing reactive interpretations of dramatic variations. Some weeks show volume and pricing moving together. Others show inverse relationships. Neither pattern automatically indicates market health or distress without proper context.
"What I emphasize to clients is that 633 closings in one week proves this market works exceptionally well," Tami notes. "Buyers are successfully purchasing homes, sellers are successfully closing transactions, and market function is robust. The pricing statistics just reflect which homes happened to close during that specific week. For buyers and sellers making individual decisions, what matters is recent comparable sales in their specific neighborhoods and price ranges, not whether this week's citywide median was $331,250 or $304,795."
For sellers specifically, Tami's guidance focuses on opportunity within context: "This volume surge creates incredible opportunity for properly positioned homes. With 633 buyers closing transactions in one week, there's clearly enormous demand. But those buyers chose homes priced correctly based on comparable sales. Sellers who understand that high volume requires competitive positioning will succeed. Those who think high volume justifies overpricing will struggle despite exceptional overall activity."
This commitment to grounding strategy in comparable sales while using weekly volume as health indicator has earned Tami recognition as a RealTrends Verified Top Agent, 15-time Five Star Professional® Award winner, and top real estate agent in San Antonio with more than 650 five-star reviews.
Three Key Takeaways
- Late March 2026 showed exceptional 633-home closing volume representing one of the highest single-week totals in recent San Antonio history, demonstrating robust spring market function and strong buyer demand across all price segments despite simultaneous pricing decreases that reflect inventory composition rebalancing rather than market deterioration. The 151-home surge from 482 to 633 closings combined with $26,455 median decline and $45,366 average decrease represents classic composition effect where entry-level and mid-range properties comprised larger share of weekly closings. Volume surges indicate market health and buyer engagement rather than concerning acceleration, while pricing adjustments reflect statistical artifacts from segment rotation rather than value depreciation requiring reactive strategic response. Buyers and sellers should interpret this pattern as confirmation of functional, active market rather than as signal of deteriorating conditions or emerging buying opportunities from distressed pricing.
- High transaction volume combined with declining prices creates strategic opportunities for informed participants while reinforcing that accurate comparable sales-based positioning remains essential regardless of overall market activity levels or weekly statistical variations. The 633-home surge confirms enormous buyer pools exist actively closing transactions across all neighborhoods and price ranges, creating optimal conditions for sellers who position properties correctly through accurate pricing and excellent presentation. However, volume alone does not guarantee individual success as buyers maintain value discipline and reject overpriced inventory regardless of overall activity. Strategic buyers benefit from confirmation that market functions effectively across all segments while recognizing that pricing decreases reflect composition rather than uniform value deterioration creating blanket negotiation opportunities. Both sides succeed through comparable sales analysis specific to target properties and neighborhoods rather than reactive interpretation of citywide weekly statistics.
- Spring market development creates dramatic week-to-week variations in volume and pricing that require professional interpretation to distinguish composition effects and closing timing artifacts from genuine market trends warranting strategic adjustment to buyer offers or seller pricing. Single-week data points provide limited individual guidance despite value as momentum and health indicators. The 633-home surge followed by subsequent week's performance will clarify whether exceptional volume sustains or moderates toward historical norms. Pricing adjustments followed by subsequent week's metrics will reveal whether composition rebalancing continues or normalizes. Working with experienced REALTOR® representation that monitors multi-week patterns, understands seasonal dynamics, provides neighborhood-specific comparable sales analysis, and grounds strategy in current market reality rather than reactive statistical interpretation creates optimal foundation for achieving real estate goals efficiently regardless of dramatic weekly variations.
Frequently Asked Questions
Q: What causes weekly sales volume to surge 31% while prices decline simultaneously? A: This combination typically indicates heavy concentration of entry-level and mid-range closings during the high-volume week. When 633 homes close with larger proportion below $280,000 compared to 482 homes with heavier upper-range representation, volume surges while medians decline due to composition shift. This reflects which price segments dominated weekly activity rather than market-wide value depreciation or concerning deterioration.
Q: Does 633 homes selling in one week indicate unsustainable market overheating? A: Not necessarily. While 633 represents exceptionally high weekly volume, spring peaks occasionally reach these levels when builder closings cluster, contract timing concentrates, and seasonal acceleration peaks simultaneously. Monitor subsequent weeks to determine whether volume sustains at elevated levels or moderates toward 400-500 range. Sustained elevation would warrant strategic attention while single-week spike followed by normalization indicates temporary concentration.
Q: Should buyers wait for further price declines before purchasing? A: Waiting strategies based on single-week pricing decreases driven by composition effects rarely succeed. The $26,455 median drop reflects inventory mix, not sustainable downward trend creating extended buying windows. Subsequent weeks may show median increases as composition shifts again. Focus on finding appropriate properties at fair prices based on comparable sales during any week rather than attempting to time statistical variations lacking predictive value.
Q: Can sellers price above comparable sales during high-volume weeks? A: No. High volume with declining prices indicates robust activity concentrated in value-conscious segments. Sellers gain pricing leverage when volume increases with rising prices and declining inventory. Current pattern shows volume without price support, reinforcing that accurate comparable sales-based pricing remains essential. Among 633 closings, properties that sold were those priced competitively based on market value, not optimistically above it.
Q: How long do volume surges like 633 homes typically last? A: Single-week volume spikes often moderate quickly as closing timing normalizes and segment concentration shifts. Sustained elevated volume of 550-650 weekly closings over 3-4 consecutive weeks would indicate exceptional spring momentum warranting strategic attention. One week followed by return to 400-500 range indicates temporary concentration. Monitor subsequent weeks rather than assuming 633 represents new sustainable baseline.
Q: Does high volume benefit buyers or sellers more? A: High volume benefits both sides by confirming healthy, functional market. Buyers benefit from confirmation that inventory flows consistently and transactions close successfully. Sellers benefit from large buyer pools creating opportunities for well-positioned properties. However, volume alone doesn't create decisive leverage for either side without accompanying price trends, inventory levels, and days-on-market patterns indicating which side holds stronger negotiating position.
Q: Should military PCS buyers accelerate purchases during high-volume weeks? A: Military buyers should focus on achieving housing goals within PCS timeline constraints based on comparable sales rather than reacting to weekly volume variations. High volume confirms market functions well but doesn't indicate improved buyer leverage or pricing unless accompanied by declining prices at property-specific level. Work with REALTOR® holding Military Relocation Professional designation for proper data interpretation and timeline management.
Q: How does new construction activity affect weekly volume and pricing statistics? A: New construction closings clustering during specific weeks based on construction completion timing can significantly impact volume and pricing statistics. Heavy builder closing weeks inflate volume while price impacts vary based on builder segment focus. If builders concentrate in entry-level segments, builder closings pull medians downward. If builders focus on upper-mid-range, builder closings elevate medians. This creates additional composition volatility beyond normal resale variation.
The Bottom Line
The San Antonio real estate market is showing exceptionally strong activity as spring 2026 progresses, with late March data revealing a remarkable 633 homes sold in one week, representing one of the highest single-week totals in recent market history. This volume surge demonstrates robust buyer demand, healthy market function, and active transaction flow across all price ranges and neighborhoods throughout Greater San Antonio.
At the same time, pricing adjusted downward with median declining $26,455 and average dropping $45,366, reflecting shifts in the types of homes closing during that particular week rather than indicating market-wide value depreciation or concerning demand deterioration. The combination of surging volume with declining prices represents inventory composition rebalancing where entry-level and mid-range properties comprised larger share of weekly closings.
Buyers may find strategic opportunities in understanding that high volume confirms market health while pricing adjustments reflect composition rather than uniform value changes creating blanket negotiation leverage. Success depends on comparable sales analysis for specific target properties in specific neighborhoods rather than reactive responses to citywide weekly statistics.
Sellers should focus on accurate pricing based on recent comparable sales combined with excellent preparation and strategic timing to capture attention from the enormous buyer pools demonstrated by 633-week closing volume. High activity creates optimal conditions for properly positioned properties while reinforcing that overpriced inventory struggles regardless of overall market momentum.
For anyone considering buying or selling in San Antonio during this robust spring market, strategy built on current comparable sales data, neighborhood-specific analysis, and professional guidance interpreting weekly variations will be essential to navigating exceptional activity levels successfully and achieving real estate goals efficiently.
Ready to discuss how late March's volume surge and pricing adjustment specifically affect your buying or selling strategy based on comparable sales in your target neighborhoods? Contact Tami Price, REALTOR®, for guidance grounded in weekly market intelligence combined with neighborhood-specific analysis and nearly two decades of San Antonio spring market experience.
Contact Tami Price, REALTOR® | San Antonio, TX
Tami Price provides expert buyer and seller representation throughout Greater San Antonio with comprehensive market analysis incorporating weekly trend monitoring, seasonal pattern recognition, and neighborhood-specific comparable sales analysis. Schedule a consultation to discuss your spring market strategy with guidance grounded in current market realities and professional data interpretation.
📞 210-620-6681
Tami Price's Specialties
- Buyer and Seller Representation
- Military Relocations and PCS Moves
- VA Loan Guidance and VA Loan Assumptions
- New Construction Representation
- First Time Home Buyers
- Move Up Buyers
- Downsizing and Rightsizing
- Strategic Pricing and Market Analysis
- San Antonio, Schertz, Cibolo, Helotes, Converse, and Boerne
Disclaimer
This blog is for informational purposes only and does not constitute legal, financial, or real estate advice. Market conditions change, and individual circumstances vary. Readers should consult qualified professionals before making real estate decisions. Tami Price, REALTOR®, is licensed in Texas and affiliated with Real Broker, LLC. Fair Housing principles apply to all content.
Categories
- All Blogs (931)
- Home Buying (13)
- Neighborhood Guides (44)
- 10 Incentive and Rate Buydown Questions (1)
- 10 Military Neighborhood (1)
- 10 Mistakes Sellers Make (1)
- 10 Strategies to Coordinate a Same Day Close (1)
- 12 Lifestyle Questions to Move In (1)
- 12 PCS What Ifs (1)
- 12 Photos and Marketing Assets (1)
- 13 PCS Hunting Trip Tips (1)
- 15 Red Flags Touring Home in San Antonio (1)
- 2026 Market (1)
- 30 days after closing your home (1)
- 7 Offer Terms Beyond Price (1)
- 7 VA Specific Questions (1)
- 78015 Ranked One (1)
- 8 Bridge (1)
- 8 Myths Buyers Believe about Down Payments (1)
- 8 Reasons VA Buyers Love New Construction (1)
- 9 Mistakes Move Up Buyers Make (1)
- 9 Questions to Decide If You Keep Your PCS Home (1)
- 9 Timeline Questions Every Buyer Need to Ask (1)
- 9 Warranty Questions to Ask (1)
- 9 Ways to Attract VA & Military Buyers (1)
- About Tami Price (6)
- Active Adult Homes (1)
- Affordable Communities (2)
- Affordable Housing & Community Development (5)
- Agent Qualifications and Credentials (1)
- Agent Qualifications and Experience (1)
- Agent Recognition (3)
- Agent Selection (1)
- AI and Real Estate Tools (1)
- Alamo Heights (5)
- Alamo Heights ISD (1)
- Alamo Heights Real Estate (1)
- Alamo Ranch (3)
- Amenities in Helotes, Texas (3)
- Apartment Market (1)
- Appraisals (1)
- Arts and Culture (1)
- Awards and Recognition (7)
- Balcones Creek (1)
- Best Neighborhoods to Live in Cibolo, TX (3)
- Best Neighborhoods to Live in San Antonio (16)
- Best Places to Live in Leon Valley: A Neighborhood Guide (1)
- Best Places to Live in Northeast Inner Loop: A Neighborhood Guide (1)
- Bexar County Property Tax (1)
- Bexar County Real Estate (3)
- Boerne Home Sellers (1)
- Boerne Neighborhoods (2)
- Boerne Texas (9)
- Broadway Corridor Development (1)
- Build-to-Rent Communities (1)
- Builder Contracts & Warranties (3)
- Builder Incentives (1)
- Builder Warranties (1)
- Buyer (97)
- Buyer Activity San Antonio (1)
- Buyer and Seller Guidance (4)
- Buyer Due Diligence (1)
- Buyer Education (46)
- Buyer Guide (9)
- Buyer Guides (7)
- Buyer Protection Strategies (1)
- Buyer Representation (1)
- Buyer Representation Expertise (1)
- Buyer Resources (88)
- Buyer Strategy (2)
- Buyers (13)
- Buyers Agent (1)
- Buying a Foreclosed Home in San Antonio (10)
- Buying a Home (3)
- Buying a Home in San Antonio (6)
- Buying Timeline (1)
- Buying vs Renting (1)
- Castroville, TX (8)
- Central San Antonio (1)
- Central San Antonio Development (2)
- Central Texas Growth (1)
- Choosing a Real Estate Agent (1)
- Choosing an Agent (1)
- Cibolo Communities (1)
- Cibolo Home Sellers (1)
- Cibolo TX (15)
- Client Reviews and Testimonials (1)
- Client Satisfaction (1)
- Client Stories (1)
- Client Testimonial (4)
- Clients review (4)
- Cobblestone (1)
- Comal County (1)
- Commercial & Retail Development (27)
- Commercial Development (13)
- Commercial Development Impact on Home Values (1)
- Commercial Real Estate (1)
- Community (1)
- Community Amenities (2)
- Community Development (23)
- Community Development and Real Estate (3)
- Community Events & Development (1)
- Community Infrastructure (1)
- Community Investment Impact (2)
- Community Landmarks (1)
- Community News (4)
- Community Planning (2)
- Community Revitalization (1)
- Community Spotlights (1)
- Commuter Neighborhoods (1)
- Cons of Living in Helotes, TX (4)
- Conservation Communities (1)
- Contingency Questions (1)
- Converse Home Sellers (1)
- Converse Homes For Sale (3)
- Converse Real Estate (1)
- Converse TX (10)
- Converse TX Real Estate (1)
- Cost of Living Guides (1)
- Cost of Living in San Antonio TX (25)
- CPS Energy Programs (1)
- Custom Homes (5)
- Davis Ranch (1)
- Days on Market (1)
- Deco District San Antonio (1)
- Denver Heights (1)
- Down Payment Assistance (1)
- Downtown Boerne (1)
- Downtown Development (3)
- Downtown Living (1)
- Downtown Revitalization (14)
- Downtown San Antonio (2)
- Downtown San Antonio Real Estate (5)
- Downtown San Antonio Revitalization (1)
- East Side Living (1)
- East Side Neighborhoods (1)
- East Side San Antonio (4)
- Economic Development (3)
- Economic Growth & Industry (1)
- Education, Texas Hill Country (1)
- Emerald Pointe (1)
- Employment (1)
- Employment Corridors (1)
- Encino Forest (1)
- Entertainment Economy (1)
- Equity and Pricing Strategy (2)
- Equity Q&A (1)
- Established Communities (3)
- Events in San Antonio (207)
- Expert Advice from Tami Price, Realtor® (10)
- Fair Oak Ranch (1)
- Family Activities (2)
- Family Homes (3)
- Family Living in San Antonio (1)
- FAQ (1)
- Far Northwest San Antonio (1)
- Far West San Antonio (1)
- Far Westside Real Estate (4)
- Fastest Growing Zip Codes in America (1)
- Featured Homes for Sale (2)
- Featured Properties (1)
- Financial Planning (10)
- Financing Strategy (1)
- First Time Buyers (23)
- First Time Sellers (1)
- First-Time Buyers (6)
- First-Time Homebuyer Resources (4)
- First-Time Homebuyer Tips (2)
- First-Time Homebuyers (6)
- First-Time Investors (1)
- Fort Sam Houston (3)
- Fort Sam Houston Real Estate (1)
- Fort Sam Houston, TX (2)
- Fox Grove (1)
- FSBO vs Agent Representation (1)
- Future Rental (1)
- Gated Communities (5)
- Golf Communities (1)
- Great Northwest (1)
- Greater San Antonio Housing Trends (2)
- Greater San Antonio Real Estate (5)
- Green Home Upgrades (1)
- Growth and Development (11)
- Healthcare (1)
- HELOC (1)
- Helotes Home Sellers (1)
- Highway 151 Corridor Growth (1)
- Hill Country Business (1)
- Hill Country Communities (2)
- Hill Country Development (3)
- Hill Country Homes for Sale (1)
- Hill Country Living (3)
- Hill Country Market Updates (1)
- Hill Country Real Estate (4)
- Hill Country Retreat (1)
- Historic Districts (5)
- Historic Neighborhoods (4)
- Historic Preservation (2)
- Holiday Attractions (1)
- Holiday Guide (1)
- Home Buying (7)
- Home Buying Education (3)
- Home Buying Guide (7)
- Home Buying Process (8)
- Home Buying Strategy (2)
- Home Buying Tips (6)
- Home Energy Efficiency San Antonio (4)
- Home Financing (2)
- Home Improvement ROI (1)
- Home Inspections (1)
- Home Preparation (2)
- Home Pricing Strategy (14)
- Home Renovation for Resale (1)
- Home Selling (10)
- Home Selling Guide (11)
- Home Selling Strategies (3)
- Home Selling Strategy (3)
- Home Selling Tips (22)
- Home Staging and Updates (2)
- Home Values (2)
- Homebuyer Education (15)
- Homebuyer Resources (1)
- Homebuying Guide (1)
- Homebuying Tips (3)
- Homeowner (36)
- Homeowner Tax Benefits (1)
- Homeownership Costs (1)
- Homes for Sale (2)
- Homes for sale near Lackland AFB (4)
- Homes Near Military Bases (1)
- Homestead amenities (1)
- Horizon Pointe (1)
- House Hunting Guide (1)
- Housing (1)
- Housing Community Development (1)
- Housing Development (2)
- Housing Market Updates (3)
- How to Buy a House in San Antonio TX (48)
- Huebner Oaks shopping center (1)
- Hunters Ranch (1)
- Hybrid (1)
- I-10 Corridor (1)
- I-35 Corridor (1)
- In Person (1)
- Incorporated Cities (6)
- Industrial Investment Impact (1)
- Industry News (2)
- Industry Recognition (1)
- Infrastructure & Growth Projects (26)
- Infrastructure and Sustainability (1)
- Infrastructure Development (1)
- Infrastructure Investment (1)
- Infrastructure Updates (2)
- Interest Rates (2)
- Invest in San Antonio (46)
- Investment Opportunities (3)
- Investment Property San Antonio (4)
- JBSA (9)
- JBSA Housing (11)
- JBSA Real Estate (4)
- JBSA Resources (7)
- Joint Base San Antonio (5)
- Joint Base San Antonio Housing (1)
- Judson ISD (2)
- Kendall County (1)
- La Cantera Retail Development (1)
- Lackland AFB (7)
- Lackland AFB Housing (1)
- Land Conservation (1)
- Land Use Planning (1)
- Lera MLS (15)
- Lifestyle & Community Growth (18)
- Lifestyle & Local Growth (12)
- Lifestyle Amenities (1)
- Lifestyle Communities (1)
- Listing Preparation (1)
- Listing Strategy (1)
- Live Oak (1)
- Living in San Antonio, TX (52)
- Living Near Randolph AFB (7)
- Loan Programs (1)
- Local Attractions (3)
- Local Business (1)
- Local Business & Development (9)
- Local Business & Economy (3)
- Local Business Spotlight (20)
- Local Business Support (5)
- Local Development (4)
- Local Development News (9)
- Local Market Insights (5)
- Local News (2)
- Local News Around San Antonio (2)
- Local Policy Changes (1)
- Local Real Estate News (1)
- Loop 1604 Corridor Growth (2)
- Loop 410 Corridor Development (1)
- Luxury Communities (3)
- Luxury Homes (2)
- Luxury Real Estate (1)
- Luxury Retail San Antonio (1)
- MacArthur Park (1)
- Major Developments (2)
- Making Offers on Homes (1)
- Market Analysis (26)
- Market Conditions (47)
- Market Expertise (1)
- Market Insights (5)
- Market Strategy (1)
- Market Timing (2)
- Market Trends (10)
- Market Trends & Insights (2)
- Market Update (17)
- Market Update 2026 (1)
- Market Updates (22)
- Master Planned Communities (12)
- Medical Center Area Real Estate (1)
- Medina Valley ISD (2)
- Midtown Living (1)
- Military & Economic Impact (3)
- Military Buyers (3)
- Military Communities (1)
- Military Families (1)
- Military Family Resources (1)
- Military Heritage (1)
- Military Homebuying (3)
- Military Homeownership (1)
- Military Housing (3)
- Military Housing Market in Texas (16)
- Military Life in San Antonio (2)
- Military Neighborhoods (1)
- Military PCS Relocations (3)
- Military Real Estate (2)
- Military Relocation (96)
- Military Relocation & VA Loans (10)
- Military Relocation San Antonio (4)
- Military Relocation Services (3)
- Military Relocation to San Antonio (50)
- Military Relocations (19)
- Military Relocations & VA Home Loans (5)
- Mixed-Income Housing (1)
- MLS Accuracy & Data Transparency (1)
- Mortgage Programs (1)
- Mothers Day in San Antonio (1)
- Move to Boerne TX (18)
- Move to Castroville TX (11)
- Move to Converse TX (16)
- Move to New Braunfels (1)
- Move to North San Antonio (19)
- Move to San Antonio TX (73)
- Move to Selma TX (19)
- Move to Shertz TX (13)
- Move to Texas (53)
- Move Up Buyer Resources (1)
- Move Up Buyers (21)
- Move-In Ready Homes (3)
- Move-In Ready Homes San Antonio (2)
- Move-Up Buyers (2)
- Moving to Helotes, TX (17)
- Moving to San Antonio (69)
- MUD Taxes (1)
- Natalia Homes For Sale (1)
- Near East Side Living (1)
- Negotiation Strategy (2)
- Neighborhood Amenities (1)
- Neighborhood Development (1)
- Neighborhood Guides (7)
- Neighborhood Investment (1)
- Neighborhood News (2)
- Neighborhood Revitalization (2)
- Neighborhood Spotlights (12)
- Neighborhood Updates (1)
- Neighborhoods near Randolph AFB (12)
- New Braunfels (6)
- New Braunfels Homes For Sale (1)
- New Braunfels News (3)
- New Braunfels Real Estate (3)
- New Businesses (2)
- New Construction (59)
- New Construction Communities (1)
- New Construction Homes (13)
- New Construction Homes San Antonio (5)
- New Construction vs Resale (1)
- New Construction Without Customization (1)
- New Construction Without the Wait (1)
- New Contruction Cost (1)
- New Development (3)
- New Listing (19)
- New Restaurants (3)
- News (211)
- News & updates (213)
- No HOA Homes (1)
- North Central San Antonio (5)
- North East ISD (4)
- North San Antonio (9)
- North San Antonio Real Estate (3)
- North Side Neighborhoods (1)
- North Side San Antonio Development (2)
- Northeast Inner Loop (1)
- Northeast Inner Loop Neighborhoods (1)
- Northeast San Antonio (3)
- Northside ISD (5)
- Northwest San Antonio (9)
- Northwest San Antonio Development (1)
- Northwest San Antonio Growth (1)
- Northwest San Antonio Real Estate (3)
- Northwood (1)
- Olympia Hills (1)
- One-Story Homes (1)
- Outdoor Living (1)
- Parks and Recreation (2)
- PCS and JBSA (2)
- PCS Guide (3)
- PCS Moves (12)
- PCS Moves to Joint Base San Antonio (4)
- PCS Planning (15)
- PCS Randolph AFB (17)
- PCS Relocation (1)
- PCS Resources (6)
- PCS San Antonio (46)
- PCS to San Antonio (42)
- Pearl District Area Real Estate (2)
- PID Assessments (1)
- Pinon Creek (1)
- Pipe Creek (1)
- Places to Eat Near Randolph AFB (1)
- Pool Homes (1)
- Pre Approval (1)
- Pre-Listing Preparation (2)
- Pre-Listing Process (1)
- Prescott Oaks (1)
- Pricing and Marketing Strategy (3)
- Professional Awards and Achievements (2)
- Professional Real Estate Representation (1)
- Property Tax Exemptions Texas (1)
- Property Value Enhancement (1)
- pros and cons living in Converse TX (3)
- Pros and Cons Living in Selma TX (6)
- Pros and Cons of Living in Castroville, TX (4)
- Pros and Cons of Living in San Antonio (33)
- PT500 List (1)
- Purchase Negotiation (1)
- Quality of Life (1)
- Quick Close Real Estate (1)
- Randolph AFB Neighborhoods (2)
- Real Estate (1)
- Real Estate Advice (1)
- Real Estate Agent Recognition (6)
- Real Estate Agent Selection (2)
- Real Estate Agent Value (1)
- Real Estate Consultation (1)
- Real Estate Finance (1)
- Real Estate Financing (1)
- Real Estate Impact (1)
- Real Estate Investment San Antonio (2)
- Real Estate Legal Issues (1)
- Real Estate Market Insights (2)
- Real Estate Market Trends (5)
- Real Estate Professional Designations (1)
- Real Estate Strategy (1)
- Real Estate Technology & Trends (2)
- Real Estate Tips (1)
- Real Estate Tips and Guides (2)
- Real Estate Trends (4)
- RealTrends Verified (1)
- Regional Development (1)
- Regional Real Estate (2)
- Relocating to San Antonio (2)
- Relocation (4)
- Relocation Resources (2)
- Relocation to San Antonio (55)
- Remote Homebuying (1)
- Rental Housing (1)
- Rental Property (1)
- Rental Strategy (1)
- Resale Properties (1)
- Retail Development (2)
- Retire in Boerne TX (11)
- Retire in San Antonio (37)
- Retirement Communities (1)
- Reviews and Recognition (1)
- Rockwall Ranch (1)
- Rural Living (2)
- SABOR (28)
- San Antonio Area Listings (1)
- San Antonio Business Growth (1)
- San Antonio Buyer Resources (2)
- San Antonio Communities (3)
- San Antonio Community Events (1)
- San Antonio Community News (1)
- San Antonio Data Center Development (1)
- San Antonio Development (5)
- San Antonio Development & East Side Real Estate (1)
- San Antonio Dining and Lifestyle (3)
- San Antonio East Side Development (1)
- San Antonio Employment Growth (1)
- San Antonio Food & Community Development (2)
- San Antonio Growth (8)
- San Antonio Home Buying and Selling (2)
- San Antonio Home Buying Guide (5)
- San Antonio Home Improvement (2)
- San antonio home prices (3)
- San Antonio Home Sellers (3)
- San Antonio Homeowner Guide (1)
- San Antonio Homeowner Resources (1)
- San Antonio Homes for Sale (12)
- San Antonio Housing Market (2)
- San Antonio Housing Market & Mortgage Financing (2)
- San Antonio Housing Market Analysis (2)
- San Antonio Housing Trends & Market Analysis (4)
- San Antonio Industrial Development (1)
- San Antonio Industrial Policy (1)
- San Antonio Investment Properties (2)
- San Antonio Job Market (1)
- San Antonio Lifestyle Amenities (1)
- San Antonio Listing (1)
- San Antonio Living (1)
- San Antonio Market (3)
- San Antonio Market Updates (18)
- San Antonio Military Relocation (2)
- San Antonio Neighborhoods (67)
- San Antonio New Construction & Master-Planned Communities (4)
- San Antonio New Home Communities (1)
- San Antonio News (229)
- San Antonio North Side Development (1)
- San Antonio Parks (1)
- San Antonio Property Investment (1)
- San Antonio Property Taxes (2)
- San Antonio Real Estate (154)
- San Antonio Real Estate Agents (6)
- San Antonio Real Estate Excellence (1)
- San Antonio Real Estate Guide (6)
- San Antonio Real Estate Market (41)
- San Antonio Real Estate Market Analysis (6)
- San Antonio Real Estate News (2)
- San Antonio REALTOR Awards (1)
- San Antonio Restaurant News (2)
- San Antonio Restaurant Openings (1)
- San Antonio Seller Resources (2)
- San Antonio Sellers (1)
- San Antonio Spec Homes (1)
- San Antonio Spurs Community Programs (1)
- San Antonio Suburbs (1)
- San Antonio Transportation (2)
- San Antonio University Area Housing (1)
- San Antonio Urban Living (7)
- San Antonio West Side Development (2)
- San Antonio Zoning Policy (1)
- Scenic Loop (1)
- Schertz Home Sellers (1)
- Schertz Real Estate (1)
- Schertz, TX (13)
- School Districts (1)
- School Information (1)
- SCUCISD Schools (1)
- Secured Quick Offer (1)
- Sell Home In San Antonio TX (64)
- Seller (83)
- Seller Education (24)
- Seller Guide (4)
- Seller Guides (1)
- Seller Representation Expertise (1)
- Seller Resources (67)
- Seller Should Understand (1)
- Seller Strategy (3)
- Seller Tips (2)
- Sellers (10)
- Selling A Home in San Antonio (62)
- Selling Your San Antonio Home (3)
- Selma TX (9)
- Single-Story Homes (4)
- Smart Homes (1)
- Solar Homes (2)
- South San Antonio Real Estate (1)
- South Side Economic Growth (1)
- South Side San Antonio (1)
- Southtown (2)
- Southwest San Antonio Real Estate (1)
- Spec Homes and Inventory Homes (2)
- Spurs Arena Project Marvel (1)
- Stone Oak (2)
- Stone Oak Community News (5)
- Suburban Housing Growth (12)
- Suburban Living (2)
- Talise De Culebra (1)
- Technology Growth (3)
- Technology Sector Growth (1)
- Terrell Hills (3)
- Texas Acreage Properties (3)
- Texas Homestead Exemption (1)
- The Dominion Real Estate (1)
- The Rim Area Real Estate (1)
- Things to do in San Antonio TX (21)
- Things to do Near Randolph AFB (4)
- Time Planning (1)
- Time-Sensitive Home Buying (1)
- Timing Strategy (1)
- Tips for Buying New Construction (9)
- Tobin Hill Neighborhoods (2)
- Top Real Estate Agent in San Antonio (3)
- Tourism and Economic Development (1)
- Traders's Joe San Antonio (1)
- Transaction Coordination (1)
- Transportation Infrastructure (1)
- Two-Story Homes (2)
- Universal City (1)
- Updated Homes (2)
- Upscale Communities (1)
- Urban Communities (2)
- Urban Corridor Real Estate (1)
- Urban Development (5)
- Urban Living (3)
- Urban Neighborhoods (4)
- Urban Real Estate (1)
- Urban Renewal Projects (1)
- Urban Revitalization San Antonio (1)
- Utility Cost Reduction (1)
- UTSA Campus Development (1)
- VA Buyers (1)
- VA Home Loan Benefits (3)
- VA Loan Assumptions (3)
- VA loan benefits (27)
- VA Loan Guidance (1)
- VA Loan Home Buying Assistance (2)
- VA Loans (69)
- VA Loans and Military Benefits (3)
- VA Loans and Military Home Buying (3)
- VA Loans San Antonio (43)
- VET Benefits Living in San Antonio (3)
- Veterans Resources (3)
- Village Northwest (1)
- Virtual Buyers (1)
- Walkable Communities (1)
- week in sales (40)
- Weekly Sales Report (41)
- West San Antonio (2)
- West San Antonio Development (1)
- West San Antonio Real Estate (3)
- West San Antonio Real Estate Market (2)
- West Side Infrastructure Planning (1)
- West Side Real Estate (1)
- West Side San Antonio (2)
- Windcrest Homes for Sale (1)
Recent Posts