
San Antonio Real Estate Market Update: Mid-March 2026
 The San Antonio housing market continues to show steady activity as March 2026 progresses, with weekly sales data from LERA MLS® highlighting a market that remains active while pricing adjusts based on the mix of homes closing each week. These short-term trends provide valuable insight for buyers and sellers who want to understand what is happening in real time across the City of San Antonio and surrounding communities as the spring selling season develops momentum throughout the Greater San Antonio area including Schertz, Cibolo, Helotes, Converse, and Boerne.
By comparing consecutive weeks in early and mid-March, a clearer picture emerges of how demand patterns, pricing normalization, and transaction volume are interacting as homeowners make decisions about buying a home in San Antonio or selling a home in San Antonio. Tami Price, REALTOR®, notes that the mid-March pricing adjustment from the prior week's elevated figures demonstrates normal market function where weekly statistics fluctuate based on inventory composition rather than indicating directional market shifts requiring immediate strategic response from all buyers and sellers. Understanding these composition-driven variations prevents reactive decisions based on single-week anomalies while maintaining vigilance for genuine multi-week trends that warrant strategic adjustments to offer positioning or listing prices.
Why This Matters for San Antonio Home Buyers and Sellers
Weekly pricing fluctuations driven by inventory composition provide important lessons about the limitations of citywide statistics for individual transaction strategy. When median prices drop from $332,000 to $321,000 and average prices decline from $405,087 to $363,535 between consecutive weeks, these changes reflect which specific homes happened to close during each period rather than uniform market depreciation affecting all properties.
For buyers, recognizing that weekly price decreases often reflect composition normalization rather than sudden affordability improvements prevents unrealistic expectations about sustained price declines that may never materialize. Different weeks close different mixes of entry-level, mid-range, and luxury properties, creating statistical variations that have limited relevance for individual purchase decisions.
For sellers, understanding that the prior week's elevated pricing reflected temporary inventory composition skew rather than new baseline market values prevents disappointment when subsequent weeks show moderation. Accurate pricing must be grounded in neighborhood-specific comparable sales analysis rather than optimistic interpretations of weekly citywide statistics that may reflect transactions in unrelated market segments.
The mid-March data demonstrates balanced market function where transaction volume remains consistent while pricing metrics fluctuate based on normal segment rotation through closing processes. This pattern characterizes healthy markets without concerning imbalances or directional momentum requiring urgent response.
What Did the Week of March 2 Through March 8, 2026, Show?
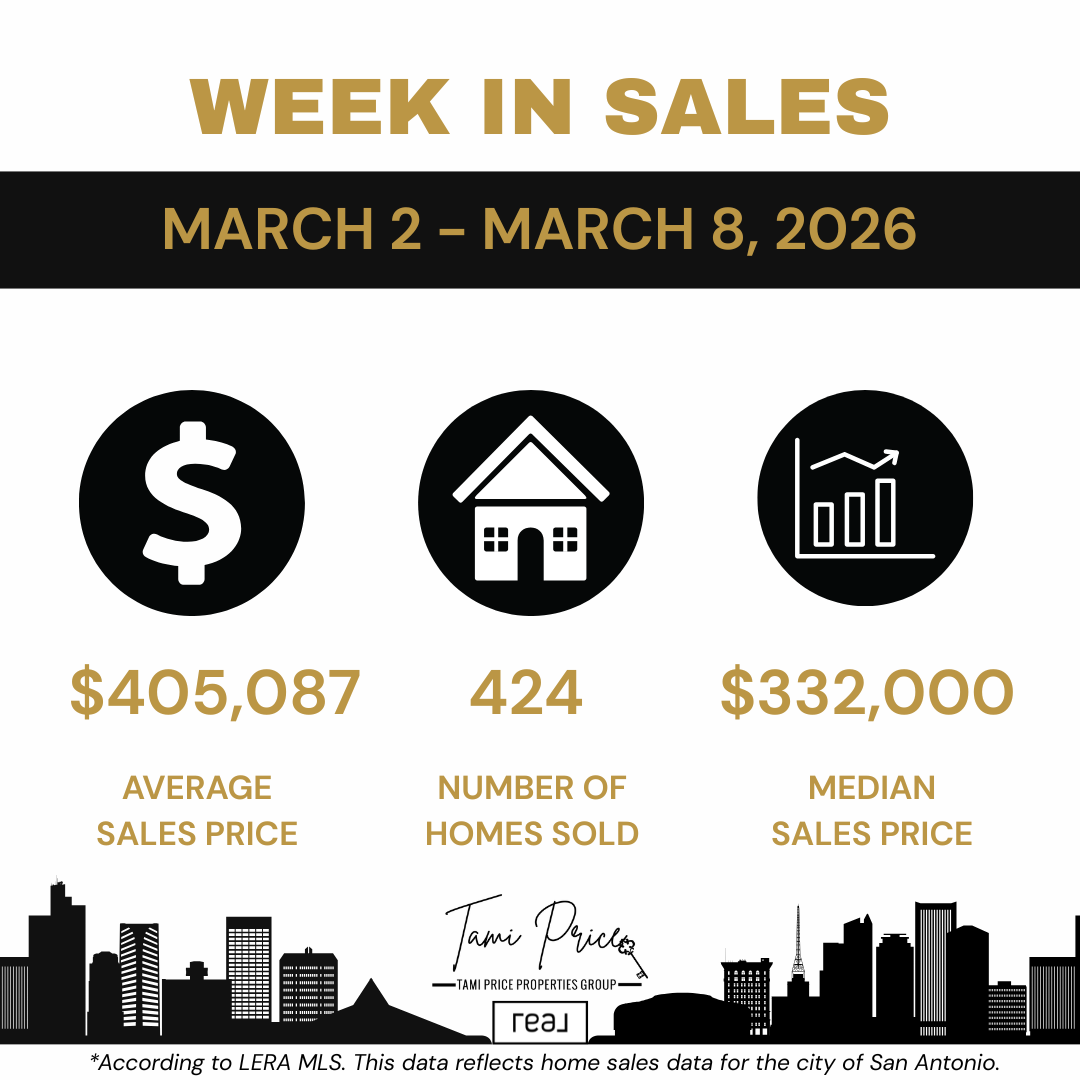
During the week of March 2 through March 8, 2026, San Antonio recorded 424 homes sold according to LERA MLS® data. The average sales price reached $405,087, while the median sales price came in at $332,000.
This week reflected elevated pricing metrics compared to historical weekly averages, with several notable characteristics:
- 424 total closed transactions indicate consistent spring market activity
- Average price of $405,087 represents the highest weekly average in recent tracking period
- Median price of $332,000 shows center of market activity in upper-mid-range segments
- The $73,087 gap between average and median indicates significant luxury representation
- Higher share of transactions occurring in upper price ranges influencing overall averages
Both the average and median sales prices appeared elevated compared to prior weeks' historical patterns. The average sales price exceeding $405,000 suggests that a higher share of total transactions occurred in upper-mid-range and luxury price ranges during this particular week, which influenced the overall average substantially through the mathematical effect of high-value outliers on arithmetic mean calculations.
The median sales price of $332,000 indicates that even with luxury home representation, many homes were still closing within mid-range price points that continue to define much of the San Antonio market's core transaction activity. The median sitting substantially below the average confirms the skewing effect of higher-priced closings on the average metric.
For sellers listing during this week, the elevated pricing metrics might have created optimistic expectations about achievable sale prices. For buyers evaluating the market during this period, the data could have raised concerns about rapidly appreciating values pricing them out of target neighborhoods.
Q: Does the $405,087 average sales price mean most homes are selling above $400,000 in San Antonio? A: No. The average is heavily influenced by luxury sales pulling it upward. The median of $332,000 shows that half of all sales occurred below that figure, meaning most transactions happened well below $400,000. The wide gap between average and median always indicates that high-priced outliers are skewing the average substantially above the center of market activity.
What Did the Week of March 9 Through March 15, 2026, Reveal?
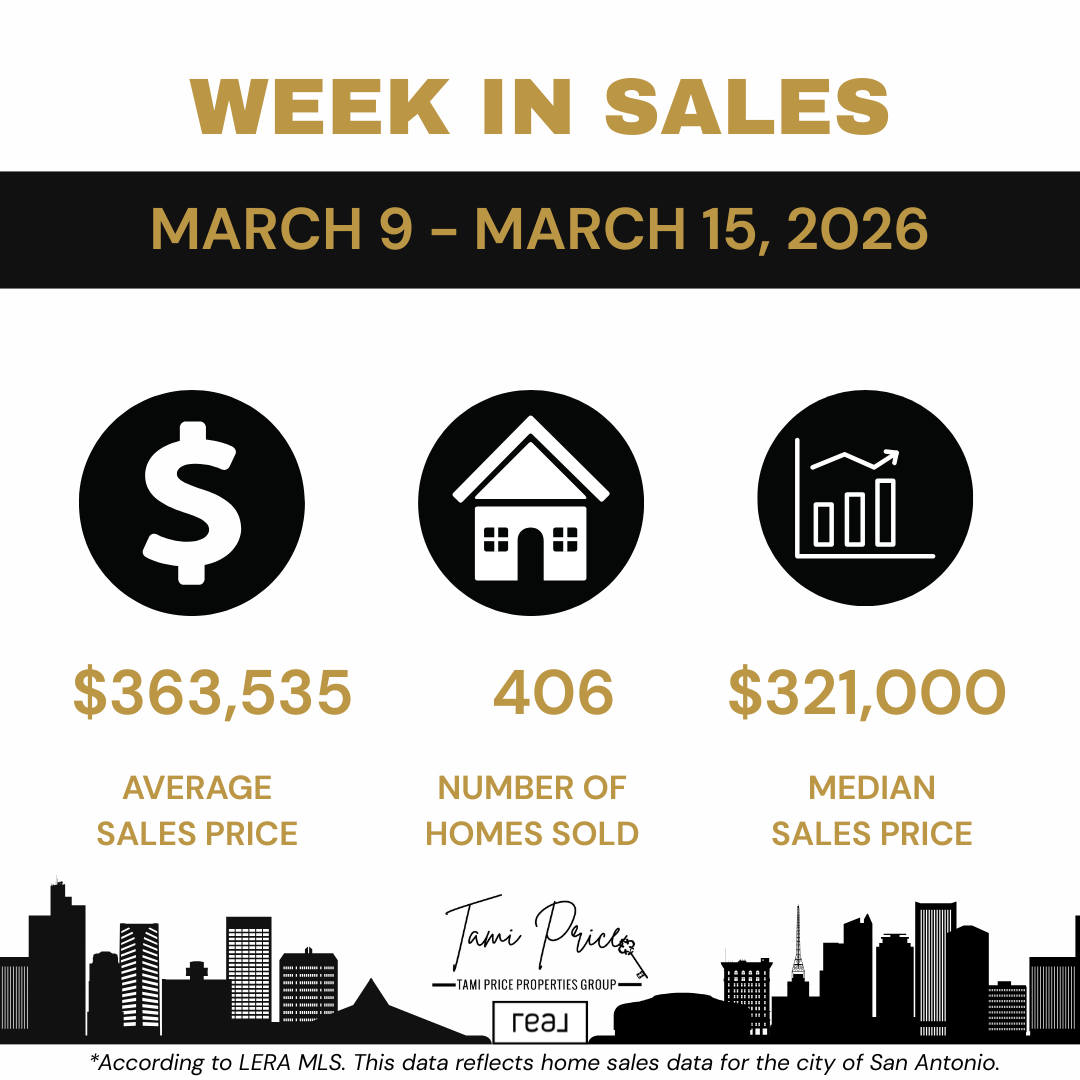
The following week showed consistent transaction activity with meaningful pricing adjustments that demonstrate normal market function and inventory composition rebalancing. During the week of March 9 through March 15, 2026, San Antonio recorded 406 homes sold with notably different pricing characteristics.
This week's data demonstrates several important patterns:
- 406 total sales representing only an 18-home decrease from the prior week
- Average sales price declining to $363,535, a $41,552 decrease from the prior week
- Median sales price moderating to $321,000, an $11,000 decrease from $332,000
- Stable volume with declining prices indicating inventory composition normalization
- Narrower $42,535 gap between average and median suggesting more balanced price distribution
While the number of homes sold remained relatively stable with only a 4% decrease, both the average and median sales prices moved downward meaningfully. This shift does not necessarily indicate a market decline, deteriorating conditions, or concerning demand weakness. Instead, it reflects the types of homes that closed during this specific week compared to the prior week's composition.
When fewer higher-priced homes close during any particular week, the average sales price adjusts downward automatically through basic mathematical calculation of mean values. Similarly, a modest decrease in median price often reflects increased transaction representation from entry-level and lower mid-range segments rather than indicating that individual property values depreciated.
Q: Does the $41,552 average price decrease signal a market correction or crash? A: No. This represents composition rebalancing, not value depreciation. When the prior week closed higher proportion of luxury homes, the average spiked to $405,087. When this week closed more balanced distribution across segments, the average normalized to $363,535. Individual home values did not decline $41,552 in one week. This pattern demonstrates why weekly averages provide limited guidance for individual property valuation or strategy.
Understanding Pricing Normalization After Composition Spikes
The mid-March pricing pattern provides an excellent case study in how inventory composition creates temporary statistical spikes followed by normalization periods. The early March week closing heavier luxury representation created elevated median and average figures. The mid-March week closing more typical distribution across all segments returned metrics toward historical norms.
Professional market analysis recognizes these rebalancing patterns as normal market function rather than directional signals requiring strategic response. Markets that experience genuine appreciation or depreciation show sustained multi-week trends in consistent directions rather than spike-and-normalize patterns driven by composition rotation.
Buyers and sellers who understand this distinction avoid reactive decisions like rushed purchases fearing continued appreciation or discouraged listing withdrawals expecting continued depreciation based on single-week variations lacking predictive value for future performance.
What Do These Mid-March Pricing Adjustments Mean for Market Direction?
Weekly fluctuations in pricing metrics are common, expected, and unremarkable in balanced real estate markets functioning normally. The data from these two consecutive mid-March weeks shows that San Antonio continues to support consistent transaction volume across multiple price points without concerning imbalances, unsustainable acceleration, or worrying deceleration.
Rather than indicating a shift in overall market direction toward either buyer or seller advantage, these pricing changes reflect normal variations in the mix of homes closing each week based on when contracts signed in prior weeks reach completion through title, inspection, appraisal, and financing processes.
Several key observations about mid-March market health emerge from this data:
- Volume stability around 400-425 closings weekly indicates consistent buyer demand
- Price variations between weeks reflect composition, not directional momentum
- Neither buyers nor sellers hold overwhelming uniform leverage across all segments
- Market rewards accurate positioning while penalizing optimistic assumptions
- Spring season development proceeds with balanced supply-demand dynamics
For buyers and sellers making strategic decisions, this data reinforces the critical importance of focusing on neighborhood-specific trends and recent comparable sales within their particular market segments rather than relying solely on citywide weekly averages that aggregate diverse transactions across unrelated price tiers and geographic areas.
Working with Tami Price, REALTOR®, buyers and sellers receive guidance grounded in comparable sales analysis specific to their target neighborhoods and price ranges rather than reactive interpretation of weekly citywide statistics subject to composition effects and limited relevance for individual transaction positioning.
What Do These Trends Mean for San Antonio Home Buyers?
For buyers watching the San Antonio market and evaluating whether current conditions favor purchase decisions, the mid-March pricing moderation following early March's spike provides important context about weekly data interpretation and strategy development. The $11,000 median decrease and $41,552 average decrease might initially suggest improving affordability and opportunity for aggressive negotiation.
However, proper analysis reveals that these decreases reflect composition normalization rather than market-wide depreciation creating improved buyer leverage. Buyers should focus on recent comparable sales in their specific target neighborhoods and price ranges rather than assuming citywide weekly statistics indicate uniform value changes across all properties.
Effective buyer strategy in mid-March spring market conditions requires:
- Pre-approval from reputable lenders demonstrating financial capacity to sellers
- Focus on comparable sales in specific neighborhoods rather than citywide weekly averages
- Understanding that weekly price variations typically reflect composition, not directional trends
- Evaluation of multiple properties to understand value ranges within target areas
- Discipline to base offers on value analysis rather than reactive responses to statistics
The current market continues to offer opportunities across all price ranges, especially when purchase decisions are based on accurate, current comparable sales data rather than assumptions about market direction based on weekly statistical variations. Buyers who are prepared, pre-approved, and working with clear understanding of current values in their target neighborhoods are better positioned to navigate changing conditions.
This preparation becomes particularly important in spring markets where increased inventory provides more choices while simultaneously bringing increased buyer competition for the most desirable properties in popular neighborhoods. The combination requires strategic positioning that recognizes when to compete aggressively on well-priced homes versus when to negotiate firmly or walk away from overpriced inventory.
Q: Should buyers make lower offers now that median prices dropped $11,000? A: No. Offers should be based on comparable sales for specific properties in specific neighborhoods, not citywide median changes reflecting composition. If recent comparable sales in your target neighborhood show homes selling at 97-99% of list price, competitive offers remain necessary for well-priced properties. Weekly median decreases provide no justification for lowball offers disconnected from comparable sales reality.
Comprehensive guidance on the home buying process in San Antonio from experienced REALTOR® representation helps buyers distinguish composition-driven statistical variations from genuine market shifts while maintaining focus on comparable sales analysis that drives successful outcomes.
What Do These Trends Signal for San Antonio Home Sellers?
For sellers contemplating listing their properties or currently on market seeking offers, the mid-March data confirms that steady sales volume around 400+ closings weekly demonstrates consistent buyer activity and healthy market function. However, the pricing moderation following early March's elevated figures reinforces critical lessons about basing strategy on neighborhood-specific comparable sales rather than optimistic interpretations of temporary citywide statistical spikes.
Sellers who observed early March's $332,000 median and $405,087 average might have developed expectations about achievable sale prices disconnected from actual comparable sales in their specific neighborhoods and price segments. Mid-March's normalization to $321,000 median and $363,535 average demonstrates why individual pricing strategy must be grounded in relevant comparable sales analysis.
Successful seller positioning in current spring market conditions requires:
- Pricing based on recent comparable sales from past 30-60 days in specific neighborhoods
- Recognition that citywide statistics aggregate diverse transactions across all segments
- Investment in proper preparation including repairs, cleaning, staging, and professional marketing
- Marketing reaching qualified buyers actively searching in your specific price range
- Responsive adjustment when showing feedback indicates positioning problems
Steady sales volume confirms that buyers remain active and transactions continue closing at healthy pace across diverse price ranges and neighborhoods. However, pricing continues to play the critical role in determining how quickly individual homes sell and how much negotiating leverage sellers maintain throughout the transaction process.
Homes that are priced in line with recent comparable sales in their specific neighborhoods tend to attract more consistent buyer interest, generate appropriate showing activity, and produce offers leading to successful closings. Sellers who rely on outdated pricing expectations from peak market years or optimistic interpretations of temporary weekly statistical spikes may experience longer days on market or require significant price adjustments to align with current buyer value expectations.
Tami Price's comprehensive approach to pricing your San Antonio home incorporates weekly trend monitoring as context while grounding actual pricing recommendations in neighborhood-specific comparable sales analysis from the past 30 to 60 days. This methodology prevents both underpricing that leaves money on the table and overpricing that extends market time unnecessarily.
Q: If a seller priced based on early March's elevated statistics, should they reduce prices now? A: Pricing should never be based on weekly citywide statistics in the first place. If a home is correctly priced based on recent comparable sales in its specific neighborhood, no adjustment is needed regardless of weekly citywide median changes. If showing activity is weak despite adequate marketing, the home is likely overpriced relative to comparable sales and should be adjusted based on that analysis, not weekly statistics.
Spring Market Preparation and Competitive Positioning
As the spring season continues developing through March into April and May, sellers face increasing inventory competition as more homeowners list properties during traditional peak selling months. Differentiation through superior property condition, professional presentation, and accurate pricing becomes essential for capturing disproportionate buyer attention.
Comprehensive pre-listing consultation evaluating current weekly trends as context, seasonal patterns, competitive inventory specific to your neighborhood, and property-specific positioning requirements provides the foundation for effective spring listing strategy that achieves results.
How Should Weekly Market Trends Be Monitored and Interpreted?
Weekly housing data provides valuable real-time snapshots of market activity, transaction volume, and pricing dynamics that reveal short-term patterns monthly summaries obscure completely. However, as mid-March's pricing fluctuation demonstrates, weekly data requires sophisticated interpretation to distinguish meaningful signals from statistical noise driven by normal inventory composition variations.
Because real estate transactions close weeks after contracts are signed following inspection periods, appraisal completion, financing approval, and title work, weekly sales numbers reflect contract activity and buyer behavior from 30 to 60 days earlier. This timing lag means that any particular week's closing composition may not represent current market conditions or buyer sentiment.
Professional real estate market analysis integrates multiple analytical approaches:
- Weekly data reveals short-term momentum, composition effects, and segment activity
- Multi-week trends distinguish genuine patterns from single-week anomalies
- Monthly data provides statistical stability reducing composition noise
- Quarterly analysis establishes seasonal patterns and year-over-year comparisons
- Neighborhood-specific comparable sales ground individual strategy in relevant data
The most effective market intelligence combines understanding of weekly tactical variations with commitment to grounding individual transaction decisions in neighborhood-specific comparable sales analysis rather than reactive responses to citywide statistics aggregating diverse transactions across unrelated market segments.
Tracking these patterns over multiple consecutive weeks provides more accurate understanding of genuine market direction than relying on single data points subject to composition effects, closing timing variations, and statistical noise inherent in small weekly sample sizes relative to monthly or quarterly aggregations.
For military families managing PCS moves to or from San Antonio under compressed timelines, understanding both weekly momentum indicators and neighborhood-specific comparable sales helps inform housing decisions that balance urgency with value protection. Working with REALTOR® representation holding the Military Relocation Professional designation ensures access to proper data interpretation alongside specialized VA loan knowledge.
How Does Tami Price, REALTOR®, Guide Clients Through Weekly Data Variations?
Tami Price, REALTOR®, closely monitors weekly LERA MLS® data to help buyers and sellers understand current market conditions while maintaining appropriate perspective about what weekly statistics reveal versus what they obscure. Her approach focuses on clarity about data limitations, realistic expectations grounded in comparable sales analysis, and strategies that reflect actual buyer and seller behavior in specific neighborhoods rather than reactive responses to citywide statistical variations.
By analyzing trends in pricing fluctuations, sales volume consistency, and inventory composition effects over multiple weeks, she helps clients navigate the market with confidence while avoiding common analytical missteps that compromise outcomes through reactive decision-making disconnected from comparable sales reality.
For buyers, this means understanding which weekly price changes reflect composition effects versus genuine neighborhood-specific appreciation, recognizing when target areas show actual value movement versus statistical artifacts, and structuring offers based on recent comparable sales rather than assumptions about market direction derived from citywide weekly statistics.
For sellers, this means setting initial list prices based on neighborhood-specific comparable sales analysis rather than optimistic interpretations of temporary weekly statistical spikes, responding to actual showing feedback and buyer interest patterns rather than weekly citywide metric changes, and making strategic adjustments grounded in market reality when positioning problems become evident.
This commitment to grounding strategy in comparable sales analysis while using weekly data as contextual momentum indicators serves clients across all segments, from first-time home buyers making initial purchases to move-up buyers coordinating sale and purchase timing to sellers managing estate situations or relocations.
Expert Insight from Tami Price
With nearly two decades representing San Antonio buyers and sellers and approximately 1,000 closed transactions across multiple market cycles, Tami Price, REALTOR®, understands that mid-March's pricing moderation following early March's spike represents normal market function and composition rebalancing rather than concerning directional shift requiring immediate strategic response.
"The mid-March pattern perfectly illustrates why I emphasize comparable sales analysis over weekly citywide statistics when working with clients," Tami explains. "Early March closed 424 homes with heavier luxury representation, pushing the average to $405,087 and median to $332,000. Mid-March closed 406 homes with more typical distribution, normalizing the average to $363,535 and median to $321,000. Neither week tells buyers or sellers anything definitive about what their specific properties are worth or how they should price offers or listings."
Tami holds multiple designations including Pricing Strategy Advisor (PSA), Seller Representative Specialist (SRS), Accredited Buyer's Representative (ABR), Graduate REALTOR® Institute (GRI), and Military Relocation Professional (MRP). These certifications reflect ongoing education in pricing methodology, market analysis, statistical interpretation, and specialized service for military families managing relocations.
Her experience across boom markets, corrections, balanced markets, and recovery phases provides perspective preventing reactive decision-making based on weekly statistical variations without understanding underlying composition effects versus genuine multi-week trends indicating real market shifts.
"What matters for my clients is not whether this week's citywide median was $332,000 or $321,000, but whether specific properties they're buying or selling are priced correctly based on recent comparable sales in their particular neighborhoods," Tami notes. "A buyer considering a $340,000 home in Stone Oak should analyze what similar homes in Stone Oak sold for recently, not react to citywide median changes driven by composition in unrelated segments. A seller listing a $380,000 home in Alamo Heights should price based on Alamo Heights comparable sales, not temporary spikes in citywide averages."
This commitment to comparable sales-based strategy over reactive statistical interpretation has earned Tami recognition as a RealTrends Verified Top Agent, 15-time Five Star Professional® Award winner, and top real estate agent in San Antonio with more than 650 five-star reviews.
Three Key Takeaways
- Mid-March's pricing moderation from early March's elevated figures demonstrates normal inventory composition rebalancing rather than directional market shift, reinforcing why buyers and sellers must base strategy on neighborhood-specific comparable sales rather than reactive interpretation of weekly citywide statistics subject to composition effects. When early March closed 424 homes with heavier luxury representation, median reached $332,000 and average spiked to $405,087. When mid-March closed 406 homes with more typical price distribution, median normalized to $321,000 and average returned to $363,535. This spike-and-normalize pattern characterizes composition-driven statistical variation rather than genuine appreciation followed by correction. Buyers who panic into rushed purchases or aggressive offers based on single-week price increases risk overpaying, while sellers who price based on temporary statistical spikes risk overpricing relative to actual comparable sales in their neighborhoods.
- Stable weekly transaction volume around 400-425 closings demonstrates healthy, balanced San Antonio market function where consistent buyer demand exists across multiple price segments without concerning imbalances, unsustainable acceleration, or worrying deceleration requiring urgent strategic response. The minimal 18-home decrease from 424 to 406 closings between consecutive weeks represents normal variation rather than demand weakness. Markets experiencing genuine problems show sustained multi-week volume declines combined with price deterioration. Current pattern shows volume consistency with pricing fluctuations driven by composition, indicating balanced conditions where neither buyers nor sellers hold overwhelming uniform leverage. Success depends on accurate positioning through comparable sales analysis rather than assuming market momentum automatically favors either side regardless of property-specific characteristics.
- Spring market development through March requires buyers and sellers to distinguish weekly statistical variations providing limited individual guidance from neighborhood-specific comparable sales analysis that drives successful transaction outcomes regardless of citywide momentum indicators. Weekly data serves valuable purpose as market health monitor and momentum indicator but provides limited guidance for individual property valuation or offer strategy. A $340,000 home's appropriate list price depends on what similar homes in that specific neighborhood sold for recently, not on whether this week's citywide median was $321,000 or $332,000. A buyer's appropriate offer on a specific property depends on comparable sales for that property type in that neighborhood, not on whether citywide averages are rising or falling week to week. Working with experienced REALTOR® representation that monitors weekly trends while grounding individual strategy in relevant comparable sales creates optimal foundation for achieving real estate goals efficiently.
Frequently Asked Questions
Q: What causes median and average prices to both decrease in the same week? A: Simultaneous decreases typically indicate that lower-priced and mid-range homes represented larger share of total closing volume during that week compared to prior weeks. When entry-level and mid-range properties comprise 70% of weekly closings instead of 55%, both the median (center point) and average (arithmetic mean) decline even when individual property values remain stable. This reflects composition normalization after prior weeks with heavier luxury representation.
Q: Does stable volume with declining prices indicate a weakening market? A: No, when the price decline follows a prior spike and represents moderation toward historical norms. Genuinely weakening markets show sustained multi-week volume declines combined with sustained price deterioration, indicating demand problems. Current mid-March pattern shows volume consistency with pricing normalization after composition-driven spike, indicating healthy balanced function rather than concerning deterioration.
Q: Should sellers reduce prices if weekly median and average both decline? A: Only if comparable sales in their specific neighborhood support lower pricing than current list price. Sellers should never price or adjust based on citywide weekly statistics. If a home is correctly priced based on recent neighborhood-specific comparable sales, citywide median or average changes provide no reason for adjustment. If showing activity suggests pricing problems, analyze neighborhood comparable sales to determine appropriate adjustment, not citywide statistics.
Q: Can buyers negotiate more aggressively when weekly prices show declines? A: Negotiation strategy should be based on property-specific positioning relative to comparable sales, not citywide weekly trends. If a property is priced accurately based on recent comparable sales in its neighborhood, aggressive negotiation based on unrelated citywide statistics will likely fail. If a property is overpriced relative to comparable sales, negotiation opportunities exist regardless of weekly citywide trends. Focus on individual property analysis, not statistical aggregates.
Q: How many consecutive weeks of price declines indicate a genuine downward trend? A: Examine at least 4-6 consecutive weeks of declining prices with declining or stable volume, combined with increasing days on market and rising inventory levels, to identify genuine cooling requiring strategic response. One or two weeks of price decreases following prior spikes typically represent composition normalization rather than trend reversal. Also verify whether declines occur uniformly across neighborhoods and segments or concentrate in specific areas.
Q: Should military PCS buyers wait for further price declines before purchasing? A: Military buyers should focus on achieving housing goals within PCS timeline constraints based on comparable sales analysis rather than attempting to time weekly price movements driven primarily by composition effects. Waiting for further declines that may never materialize risks missing appropriate properties while paying rent or temporary housing costs. Work with REALTOR® holding Military Relocation Professional designation for proper data interpretation and timeline management.
Q: How does new construction activity affect weekly resale statistics? A: New construction closings clustering in specific weeks based on construction completion timing can significantly influence weekly statistics. Heavy builder closing weeks may skew averages and medians upward if new construction concentrates in higher price tiers or downward if builders focus on entry-level segments. This creates additional composition volatility in weekly data beyond normal resale variation, reinforcing the importance of multi-week trend analysis.
Q: What metrics indicate whether spring market favors buyers or sellers in San Antonio? A: Balanced markets like current San Antonio conditions show stable volume, modest price fluctuations around stable baselines, moderate inventory levels neither severely constrained nor excessively abundant, and days on market remaining consistent without dramatic acceleration or extension. Neither buyers nor sellers hold decisive uniform leverage. Success depends on accurate positioning for both sides rather than market timing or assuming momentum automatically favors one group.
The Bottom Line
The San Antonio real estate market in mid-March 2026 remains steady, balanced, and characterized by healthy function where transaction volume stays consistent around 400+ weekly closings while pricing metrics fluctuate based on normal inventory composition variations rather than directional momentum shifts. The pricing moderation from early March's elevated figures demonstrates composition rebalancing rather than concerning market deterioration, reinforcing the critical importance of basing strategy on neighborhood-specific comparable sales analysis.
For buyers deciding to buy a home in San Antonio, mid-March trends confirm that opportunities exist across all price ranges when decisions are grounded in comparable sales analysis for specific target neighborhoods rather than reactive responses to citywide weekly statistics subject to composition effects. Financial preparation, disciplined value analysis, and strategic positioning based on relevant comparable sales create competitive advantages during spring market development.
For sellers deciding to sell your San Antonio home, mid-March data reinforces that consistent buyer activity supports successful outcomes for properly positioned properties while accurate pricing based on neighborhood-specific comparable sales remains essential regardless of temporary weekly statistical variations. Preparation, presentation quality, and pricing strategy aligned with current comparable sales drive results as spring inventory competition increases.
Success in this market depends on preparation, accurate comparable sales-based pricing, and clear understanding of current neighborhood-specific trends rather than reactive interpretation of weekly citywide statistics. Weekly data provides valuable context about market momentum and health, but individual transaction strategy must be grounded in relevant comparable sales analysis that reflects actual buyer behavior in specific market segments.
Ready to discuss how current San Antonio market trends and mid-March dynamics specifically affect your buying or selling strategy based on comparable sales in your target neighborhoods? Contact Tami Price, REALTOR®, for guidance grounded in weekly market intelligence combined with neighborhood-specific analysis and nearly two decades of San Antonio real estate experience.

Contact Tami Price, REALTOR® | San Antonio, TX
Tami Price provides expert buyer and seller representation throughout Greater San Antonio with comprehensive market analysis incorporating weekly trend monitoring, seasonal pattern recognition, and neighborhood-specific comparable sales analysis. Schedule a consultation to discuss your real estate goals with guidance grounded in current market realities and professional data interpretation.
📞 210-620-6681
Tami Price's Specialties
- Buyer and Seller Representation
- Military Relocations and PCS Moves
- VA Loan Guidance and VA Loan Assumptions
- New Construction Representation
- First Time Home Buyers
- Move Up Buyers
- Downsizing and Rightsizing
- Strategic Pricing and Market Analysis
- San Antonio, Schertz, Cibolo, Helotes, Converse, and Boerne
Disclaimer
This blog is for informational purposes only and does not constitute legal, financial, or real estate advice. Market conditions change, and individual circumstances vary. Readers should consult qualified professionals before making real estate decisions. Tami Price, REALTOR®, is licensed in Texas and affiliated with Real Broker, LLC. Fair Housing principles apply to all content.
Categories
- All Blogs (914)
- Home Buying (10)
- Neighborhood Guides (44)
- 10 Military Neighborhood (1)
- 10 Mistakes Sellers Make (1)
- 10 Strategies to Coordinate a Same Day Close (1)
- 12 Lifestyle Questions to Move In (1)
- 12 Photos and Marketing Assets (1)
- 13 PCS Hunting Trip Tips (1)
- 15 Red Flags Touring Home in San Antonio (1)
- 2026 Market (1)
- 7 Offer Terms Beyond Price (1)
- 78015 Ranked One (1)
- 8 Bridge (1)
- 8 Myths Buyers Believe about Down Payments (1)
- 8 Reasons VA Buyers Love New Construction (1)
- 9 Questions to Decide If You Keep Your PCS Home (1)
- 9 Timeline Questions Every Buyer Need to Ask (1)
- 9 Ways to Attract VA & Military Buyers (1)
- About Tami Price (5)
- Affordable Communities (2)
- Affordable Housing & Community Development (5)
- Agent Qualifications and Credentials (1)
- Agent Qualifications and Experience (1)
- Agent Recognition (3)
- Agent Selection (1)
- AI and Real Estate Tools (1)
- Alamo Heights (5)
- Alamo Heights ISD (1)
- Alamo Heights Real Estate (1)
- Alamo Ranch (2)
- Amenities in Helotes, Texas (3)
- Apartment Market (1)
- Appraisals (1)
- Arts and Culture (1)
- Awards and Recognition (6)
- Balcones Creek (1)
- Best Neighborhoods to Live in Cibolo, TX (3)
- Best Neighborhoods to Live in San Antonio (16)
- Best Places to Live in Leon Valley: A Neighborhood Guide (1)
- Best Places to Live in Northeast Inner Loop: A Neighborhood Guide (1)
- Bexar County Property Tax (1)
- Bexar County Real Estate (3)
- Boerne Home Sellers (1)
- Boerne Neighborhoods (2)
- Boerne Texas (9)
- Broadway Corridor Development (1)
- Build-to-Rent Communities (1)
- Builder Contracts & Warranties (3)
- Builder Incentives (1)
- Builder Warranties (1)
- Buyer (97)
- Buyer Activity San Antonio (1)
- Buyer and Seller Guidance (4)
- Buyer Due Diligence (1)
- Buyer Education (46)
- Buyer Guide (9)
- Buyer Guides (7)
- Buyer Protection Strategies (1)
- Buyer Representation (1)
- Buyer Representation Expertise (1)
- Buyer Resources (82)
- Buyer Strategy (2)
- Buyers (13)
- Buyers Agent (1)
- Buying a Foreclosed Home in San Antonio (10)
- Buying a Home (2)
- Buying a Home in San Antonio (6)
- Buying Timeline (1)
- Castroville, TX (8)
- Central San Antonio (1)
- Central San Antonio Development (2)
- Central Texas Growth (1)
- Choosing a Real Estate Agent (1)
- Choosing an Agent (1)
- Cibolo Communities (1)
- Cibolo Home Sellers (1)
- Cibolo TX (15)
- Client Reviews and Testimonials (1)
- Client Satisfaction (1)
- Client Stories (1)
- Client Testimonial (4)
- Clients review (4)
- Cobblestone (1)
- Comal County (1)
- Commercial & Retail Development (27)
- Commercial Development (13)
- Commercial Development Impact on Home Values (1)
- Commercial Real Estate (1)
- Community (1)
- Community Amenities (2)
- Community Development (23)
- Community Development and Real Estate (3)
- Community Events & Development (1)
- Community Infrastructure (1)
- Community Investment Impact (2)
- Community Landmarks (1)
- Community News (4)
- Community Planning (2)
- Community Revitalization (1)
- Community Spotlights (1)
- Commuter Neighborhoods (1)
- Cons of Living in Helotes, TX (4)
- Conservation Communities (1)
- Contingency Questions (1)
- Converse Home Sellers (1)
- Converse Homes For Sale (3)
- Converse Real Estate (1)
- Converse TX (10)
- Converse TX Real Estate (1)
- Cost of Living Guides (1)
- Cost of Living in San Antonio TX (25)
- CPS Energy Programs (1)
- Custom Homes (5)
- Davis Ranch (1)
- Days on Market (1)
- Deco District San Antonio (1)
- Denver Heights (1)
- Down Payment Assistance (1)
- Downtown Boerne (1)
- Downtown Development (3)
- Downtown Living (1)
- Downtown Revitalization (14)
- Downtown San Antonio (2)
- Downtown San Antonio Real Estate (5)
- Downtown San Antonio Revitalization (1)
- East Side Living (1)
- East Side Neighborhoods (1)
- East Side San Antonio (4)
- Economic Development (3)
- Economic Growth & Industry (1)
- Education, Texas Hill Country (1)
- Emerald Pointe (1)
- Employment (1)
- Employment Corridors (1)
- Encino Forest (1)
- Entertainment Economy (1)
- Equity and Pricing Strategy (2)
- Equity Q&A (1)
- Established Communities (3)
- Events in San Antonio (207)
- Expert Advice from Tami Price, Realtor® (10)
- Fair Oak Ranch (1)
- Family Activities (2)
- Family Homes (3)
- Family Living in San Antonio (1)
- FAQ (1)
- Far Northwest San Antonio (1)
- Far West San Antonio (1)
- Far Westside Real Estate (4)
- Fastest Growing Zip Codes in America (1)
- Featured Homes for Sale (2)
- Featured Properties (1)
- Financial Planning (7)
- Financing Strategy (1)
- First Time Buyers (21)
- First Time Sellers (1)
- First-Time Buyers (6)
- First-Time Homebuyer Resources (4)
- First-Time Homebuyer Tips (2)
- First-Time Homebuyers (6)
- First-Time Investors (1)
- Fort Sam Houston (3)
- Fort Sam Houston Real Estate (1)
- Fort Sam Houston, TX (2)
- Fox Grove (1)
- FSBO vs Agent Representation (1)
- Gated Communities (5)
- Golf Communities (1)
- Great Northwest (1)
- Greater San Antonio Housing Trends (2)
- Greater San Antonio Real Estate (5)
- Green Home Upgrades (1)
- Growth and Development (11)
- Healthcare (1)
- HELOC (1)
- Helotes Home Sellers (1)
- Highway 151 Corridor Growth (1)
- Hill Country Business (1)
- Hill Country Communities (2)
- Hill Country Development (3)
- Hill Country Homes for Sale (1)
- Hill Country Living (3)
- Hill Country Market Updates (1)
- Hill Country Real Estate (4)
- Historic Districts (5)
- Historic Neighborhoods (4)
- Historic Preservation (2)
- Holiday Attractions (1)
- Holiday Guide (1)
- Home Buying (7)
- Home Buying Education (3)
- Home Buying Guide (7)
- Home Buying Process (8)
- Home Buying Strategy (2)
- Home Buying Tips (6)
- Home Energy Efficiency San Antonio (4)
- Home Financing (2)
- Home Improvement ROI (1)
- Home Inspections (1)
- Home Preparation (2)
- Home Pricing Strategy (13)
- Home Renovation for Resale (1)
- Home Selling (8)
- Home Selling Guide (10)
- Home Selling Strategies (3)
- Home Selling Strategy (3)
- Home Selling Tips (22)
- Home Staging and Updates (2)
- Home Values (2)
- Homebuyer Education (15)
- Homebuyer Resources (1)
- Homebuying Guide (1)
- Homebuying Tips (3)
- Homeowner (35)
- Homeowner Tax Benefits (1)
- Homeownership Costs (1)
- Homes for Sale (2)
- Homes for sale near Lackland AFB (4)
- Homes Near Military Bases (1)
- Homestead amenities (1)
- Horizon Pointe (1)
- House Hunting Guide (1)
- Housing (1)
- Housing Community Development (1)
- Housing Development (2)
- Housing Market Updates (3)
- How to Buy a House in San Antonio TX (48)
- Huebner Oaks shopping center (1)
- Hunters Ranch (1)
- Hybrid (1)
- I-10 Corridor (1)
- I-35 Corridor (1)
- In Person (1)
- Incorporated Cities (6)
- Industrial Investment Impact (1)
- Industry News (2)
- Industry Recognition (1)
- Infrastructure & Growth Projects (26)
- Infrastructure and Sustainability (1)
- Infrastructure Development (1)
- Infrastructure Investment (1)
- Infrastructure Updates (2)
- Interest Rates (2)
- Invest in San Antonio (46)
- Investment Opportunities (2)
- Investment Property San Antonio (4)
- JBSA (9)
- JBSA Housing (11)
- JBSA Real Estate (4)
- JBSA Resources (7)
- Joint Base San Antonio (5)
- Joint Base San Antonio Housing (1)
- Judson ISD (2)
- Kendall County (1)
- La Cantera Retail Development (1)
- Lackland AFB (7)
- Lackland AFB Housing (1)
- Land Conservation (1)
- Land Use Planning (1)
- Lera MLS (14)
- Lifestyle & Community Growth (18)
- Lifestyle & Local Growth (12)
- Lifestyle Amenities (1)
- Lifestyle Communities (1)
- Listing Preparation (1)
- Listing Strategy (1)
- Live Oak (1)
- Living in San Antonio, TX (52)
- Living Near Randolph AFB (7)
- Loan Programs (1)
- Local Attractions (3)
- Local Business (1)
- Local Business & Development (9)
- Local Business & Economy (3)
- Local Business Spotlight (20)
- Local Business Support (5)
- Local Development (4)
- Local Development News (9)
- Local Market Insights (5)
- Local News (2)
- Local News Around San Antonio (2)
- Local Policy Changes (1)
- Local Real Estate News (1)
- Loop 1604 Corridor Growth (2)
- Loop 410 Corridor Development (1)
- Luxury Communities (3)
- Luxury Homes (2)
- Luxury Real Estate (1)
- Luxury Retail San Antonio (1)
- MacArthur Park (1)
- Major Developments (2)
- Making Offers on Homes (1)
- Market Analysis (26)
- Market Conditions (45)
- Market Expertise (1)
- Market Insights (5)
- Market Strategy (1)
- Market Timing (2)
- Market Trends (10)
- Market Trends & Insights (2)
- Market Update (15)
- Market Update 2026 (1)
- Market Updates (20)
- Master Planned Communities (12)
- Medical Center Area Real Estate (1)
- Medina Valley ISD (2)
- Midtown Living (1)
- Military & Economic Impact (3)
- Military Buyers (2)
- Military Communities (1)
- Military Families (1)
- Military Family Resources (1)
- Military Heritage (1)
- Military Homebuying (2)
- Military Homeownership (1)
- Military Housing (3)
- Military Housing Market in Texas (16)
- Military Life in San Antonio (2)
- Military Neighborhoods (1)
- Military PCS Relocations (3)
- Military Real Estate (2)
- Military Relocation (89)
- Military Relocation & VA Loans (9)
- Military Relocation San Antonio (4)
- Military Relocation Services (3)
- Military Relocation to San Antonio (50)
- Military Relocations (18)
- Military Relocations & VA Home Loans (5)
- Mixed-Income Housing (1)
- MLS Accuracy & Data Transparency (1)
- Mortgage Programs (1)
- Mothers Day in San Antonio (1)
- Move to Boerne TX (18)
- Move to Castroville TX (11)
- Move to Converse TX (16)
- Move to New Braunfels (1)
- Move to North San Antonio (19)
- Move to San Antonio TX (73)
- Move to Selma TX (19)
- Move to Shertz TX (13)
- Move to Texas (53)
- Move Up Buyer Resources (1)
- Move Up Buyers (19)
- Move-In Ready Homes (3)
- Move-In Ready Homes San Antonio (2)
- Move-Up Buyers (2)
- Moving to Helotes, TX (17)
- Moving to San Antonio (69)
- MUD Taxes (1)
- Natalia Homes For Sale (1)
- Near East Side Living (1)
- Negotiation Strategy (2)
- Neighborhood Amenities (1)
- Neighborhood Development (1)
- Neighborhood Guides (7)
- Neighborhood Investment (1)
- Neighborhood News (2)
- Neighborhood Revitalization (2)
- Neighborhood Spotlights (12)
- Neighborhood Updates (1)
- Neighborhoods near Randolph AFB (12)
- New Braunfels (6)
- New Braunfels Homes For Sale (1)
- New Braunfels News (3)
- New Braunfels Real Estate (3)
- New Businesses (2)
- New Construction (55)
- New Construction Communities (1)
- New Construction Homes (13)
- New Construction Homes San Antonio (5)
- New Construction vs Resale (1)
- New Construction Without Customization (1)
- New Construction Without the Wait (1)
- New Contruction Cost (1)
- New Development (3)
- New Listing (19)
- New Restaurants (3)
- News (211)
- News & updates (213)
- No HOA Homes (1)
- North Central San Antonio (5)
- North East ISD (3)
- North San Antonio (9)
- North San Antonio Real Estate (3)
- North Side Neighborhoods (1)
- North Side San Antonio Development (2)
- Northeast Inner Loop (1)
- Northeast Inner Loop Neighborhoods (1)
- Northeast San Antonio (3)
- Northside ISD (5)
- Northwest San Antonio (9)
- Northwest San Antonio Development (1)
- Northwest San Antonio Growth (1)
- Northwest San Antonio Real Estate (3)
- Northwood (1)
- Olympia Hills (1)
- One-Story Homes (1)
- Outdoor Living (1)
- Parks and Recreation (2)
- PCS and JBSA (2)
- PCS Guide (3)
- PCS Moves (12)
- PCS Moves to Joint Base San Antonio (4)
- PCS Planning (14)
- PCS Randolph AFB (17)
- PCS Relocation (1)
- PCS Resources (6)
- PCS San Antonio (46)
- PCS to San Antonio (42)
- Pearl District Area Real Estate (2)
- PID Assessments (1)
- Pipe Creek (1)
- Places to Eat Near Randolph AFB (1)
- Pool Homes (1)
- Pre Approval (1)
- Pre-Listing Preparation (2)
- Pre-Listing Process (1)
- Prescott Oaks (1)
- Pricing and Marketing Strategy (3)
- Professional Awards and Achievements (2)
- Professional Real Estate Representation (1)
- Property Tax Exemptions Texas (1)
- Property Value Enhancement (1)
- pros and cons living in Converse TX (3)
- Pros and Cons Living in Selma TX (6)
- Pros and Cons of Living in Castroville, TX (4)
- Pros and Cons of Living in San Antonio (33)
- PT500 List (1)
- Purchase Negotiation (1)
- Quality of Life (1)
- Quick Close Real Estate (1)
- Randolph AFB Neighborhoods (2)
- Real Estate (1)
- Real Estate Advice (1)
- Real Estate Agent Recognition (6)
- Real Estate Agent Selection (2)
- Real Estate Agent Value (1)
- Real Estate Consultation (1)
- Real Estate Finance (1)
- Real Estate Financing (1)
- Real Estate Impact (1)
- Real Estate Investment San Antonio (2)
- Real Estate Legal Issues (1)
- Real Estate Market Insights (2)
- Real Estate Market Trends (5)
- Real Estate Professional Designations (1)
- Real Estate Strategy (1)
- Real Estate Technology & Trends (2)
- Real Estate Tips (1)
- Real Estate Tips and Guides (2)
- Real Estate Trends (4)
- RealTrends Verified (1)
- Regional Development (1)
- Regional Real Estate (2)
- Relocating to San Antonio (2)
- Relocation (4)
- Relocation Resources (2)
- Relocation to San Antonio (55)
- Remote Homebuying (1)
- Rental Housing (1)
- Rental Property (1)
- Rental Strategy (1)
- Resale Properties (1)
- Retail Development (2)
- Retire in Boerne TX (11)
- Retire in San Antonio (37)
- Reviews and Recognition (1)
- Rockwall Ranch (1)
- Rural Living (2)
- SABOR (27)
- San Antonio Area Listings (1)
- San Antonio Business Growth (1)
- San Antonio Buyer Resources (2)
- San Antonio Communities (3)
- San Antonio Community Events (1)
- San Antonio Community News (1)
- San Antonio Data Center Development (1)
- San Antonio Development (5)
- San Antonio Development & East Side Real Estate (1)
- San Antonio Dining and Lifestyle (3)
- San Antonio East Side Development (1)
- San Antonio Employment Growth (1)
- San Antonio Food & Community Development (2)
- San Antonio Growth (8)
- San Antonio Home Buying and Selling (2)
- San Antonio Home Buying Guide (5)
- San Antonio Home Improvement (2)
- San antonio home prices (3)
- San Antonio Home Sellers (3)
- San Antonio Homeowner Guide (1)
- San Antonio Homeowner Resources (1)
- San Antonio Homes for Sale (10)
- San Antonio Housing Market (2)
- San Antonio Housing Market & Mortgage Financing (2)
- San Antonio Housing Market Analysis (2)
- San Antonio Housing Trends & Market Analysis (4)
- San Antonio Industrial Development (1)
- San Antonio Industrial Policy (1)
- San Antonio Investment Properties (2)
- San Antonio Job Market (1)
- San Antonio Lifestyle Amenities (1)
- San Antonio Listing (1)
- San Antonio Living (1)
- San Antonio Market (3)
- San Antonio Market Updates (18)
- San Antonio Military Relocation (2)
- San Antonio Neighborhoods (67)
- San Antonio New Construction & Master-Planned Communities (4)
- San Antonio New Home Communities (1)
- San Antonio News (229)
- San Antonio North Side Development (1)
- San Antonio Parks (1)
- San Antonio Property Investment (1)
- San Antonio Property Taxes (2)
- San Antonio Real Estate (145)
- San Antonio Real Estate Agents (5)
- San Antonio Real Estate Excellence (1)
- San Antonio Real Estate Guide (6)
- San Antonio Real Estate Market (41)
- San Antonio Real Estate Market Analysis (6)
- San Antonio Real Estate News (2)
- San Antonio REALTOR Awards (1)
- San Antonio Restaurant News (2)
- San Antonio Restaurant Openings (1)
- San Antonio Seller Resources (2)
- San Antonio Sellers (1)
- San Antonio Spec Homes (1)
- San Antonio Spurs Community Programs (1)
- San Antonio Suburbs (1)
- San Antonio Transportation (2)
- San Antonio University Area Housing (1)
- San Antonio Urban Living (7)
- San Antonio West Side Development (2)
- San Antonio Zoning Policy (1)
- Scenic Loop (1)
- Schertz Home Sellers (1)
- Schertz Real Estate (1)
- Schertz, TX (13)
- School Districts (1)
- School Information (1)
- SCUCISD Schools (1)
- Secured Quick Offer (1)
- Sell Home In San Antonio TX (64)
- Seller (83)
- Seller Education (24)
- Seller Guide (4)
- Seller Guides (1)
- Seller Representation Expertise (1)
- Seller Resources (64)
- Seller Should Understand (1)
- Seller Strategy (3)
- Seller Tips (2)
- Sellers (10)
- Selling A Home in San Antonio (62)
- Selling Your San Antonio Home (3)
- Selma TX (9)
- Single-Story Homes (4)
- Smart Homes (1)
- Solar Homes (2)
- South San Antonio Real Estate (1)
- South Side Economic Growth (1)
- South Side San Antonio (1)
- Southtown (2)
- Southwest San Antonio Real Estate (1)
- Spec Homes and Inventory Homes (1)
- Spurs Arena Project Marvel (1)
- Stone Oak (1)
- Stone Oak Community News (5)
- Suburban Housing Growth (12)
- Suburban Living (2)
- Talise De Culebra (1)
- Technology Growth (3)
- Technology Sector Growth (1)
- Terrell Hills (3)
- Texas Acreage Properties (3)
- Texas Homestead Exemption (1)
- The Dominion Real Estate (1)
- The Rim Area Real Estate (1)
- Things to do in San Antonio TX (21)
- Things to do Near Randolph AFB (4)
- Time Planning (1)
- Time-Sensitive Home Buying (1)
- Timing Strategy (1)
- Tips for Buying New Construction (9)
- Tobin Hill Neighborhoods (2)
- Top Real Estate Agent in San Antonio (3)
- Tourism and Economic Development (1)
- Traders's Joe San Antonio (1)
- Transaction Coordination (1)
- Transportation Infrastructure (1)
- Two-Story Homes (2)
- Universal City (1)
- Updated Homes (1)
- Upscale Communities (1)
- Urban Communities (2)
- Urban Corridor Real Estate (1)
- Urban Development (5)
- Urban Living (3)
- Urban Neighborhoods (4)
- Urban Real Estate (1)
- Urban Renewal Projects (1)
- Urban Revitalization San Antonio (1)
- Utility Cost Reduction (1)
- UTSA Campus Development (1)
- VA Buyers (1)
- VA Home Loan Benefits (3)
- VA Loan Assumptions (3)
- VA loan benefits (27)
- VA Loan Guidance (1)
- VA Loan Home Buying Assistance (2)
- VA Loans (65)
- VA Loans and Military Benefits (3)
- VA Loans and Military Home Buying (3)
- VA Loans San Antonio (43)
- VET Benefits Living in San Antonio (3)
- Veterans Resources (2)
- Village Northwest (1)
- Virtual Buyers (1)
- Walkable Communities (1)
- week in sales (38)
- Weekly Sales Report (39)
- West San Antonio (2)
- West San Antonio Development (1)
- West San Antonio Real Estate (3)
- West San Antonio Real Estate Market (2)
- West Side Infrastructure Planning (1)
- West Side Real Estate (1)
- West Side San Antonio (2)
- Windcrest Homes for Sale (1)
Recent Posts