San Antonio Real Estate Market Update: What Late December and Early January 2026 Sales Data Reveal About Current Buyer Activity and Pricing Trends
The San Antonio real estate market has entered 2026 with clear signals about buyer activity, pricing behavior, and seasonal patterns that directly impact housing decisions for both buyers and sellers. Reviewing weekly sales data from the final week of December 2025 and the first full week of January 2026 provides valuable insight for anyone planning to buy or sell a home in San Antonio, Schertz, Cibolo, Helotes, Converse, or Boerne during the current market cycle.
Tami Price, REALTOR®, closely tracks weekly MLS® trends to help clients understand what is happening right now, not what happened months ago, allowing buyers and sellers to make decisions based on current market conditions rather than outdated assumptions. These short-term data points offer a realistic snapshot of how the market is behaving as the new year begins, revealing opportunities for buyers seeking negotiation leverage and strategic guidance for sellers evaluating timing and pricing decisions.
Understanding these weekly patterns matters because San Antonio's real estate market operates across diverse price points, neighborhood types, and buyer segments. What works in one corridor may not apply in another, and seasonal shifts create windows of opportunity that require accurate, current data to identify and capitalize on effectively.
What Do the Weekly Sales Numbers from Late December 2025 and Early January 2026 Tell Us About San Antonio's Market?
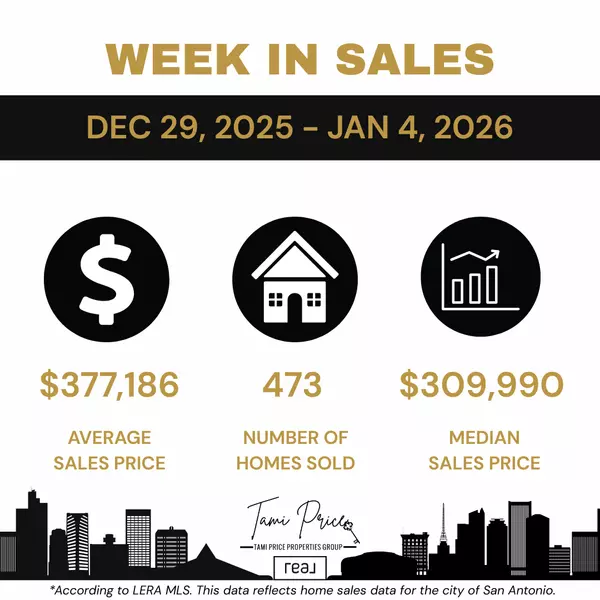
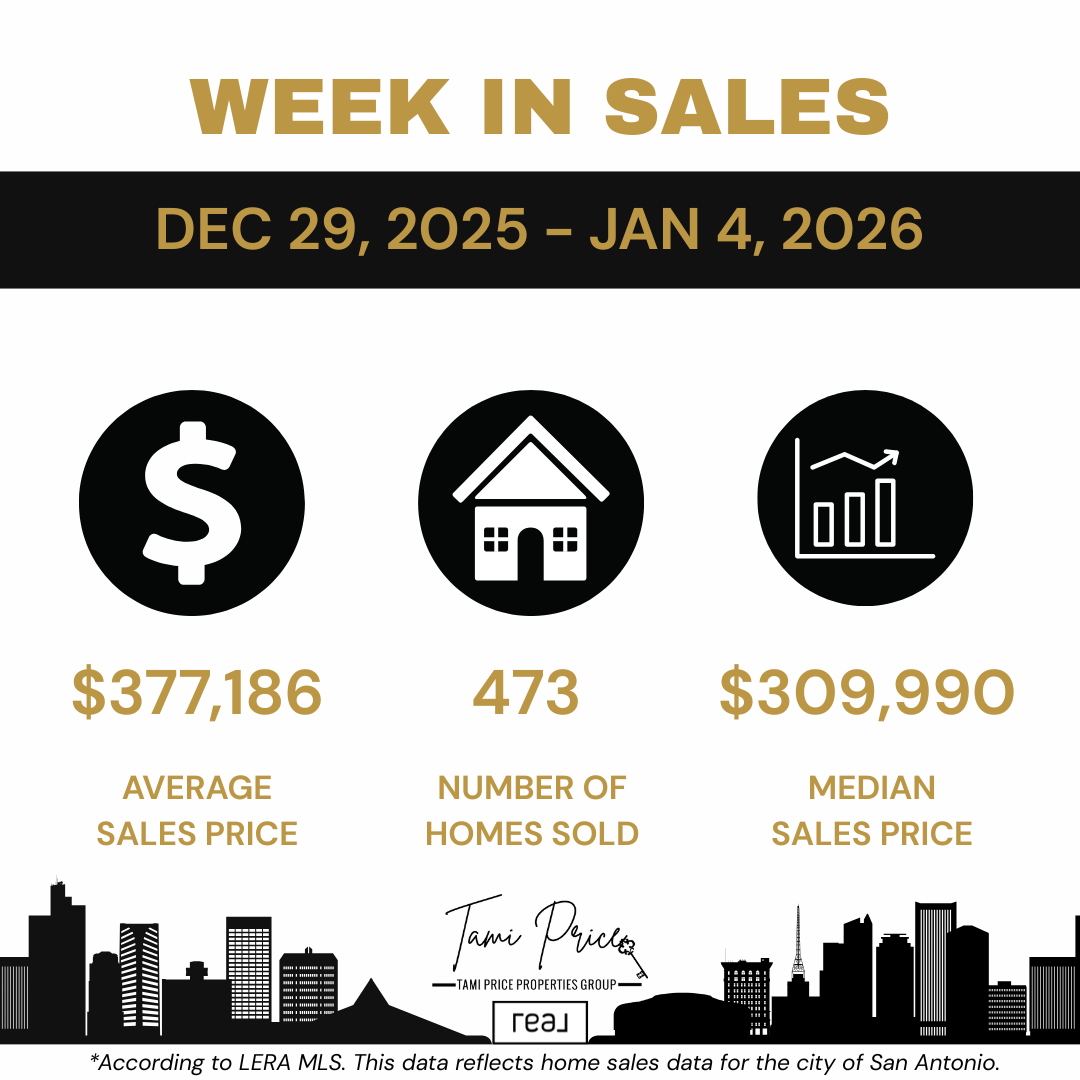
From December 29, 2025 through January 4, 2026, San Antonio recorded 473 homes sold according to MLS® data. The average sales price during this period was $377,186, and the median sales price was $309,990. This week reflected a strong post-holiday rebound, with buyers re-entering the market and completing transactions that had been in motion before the end of the year.
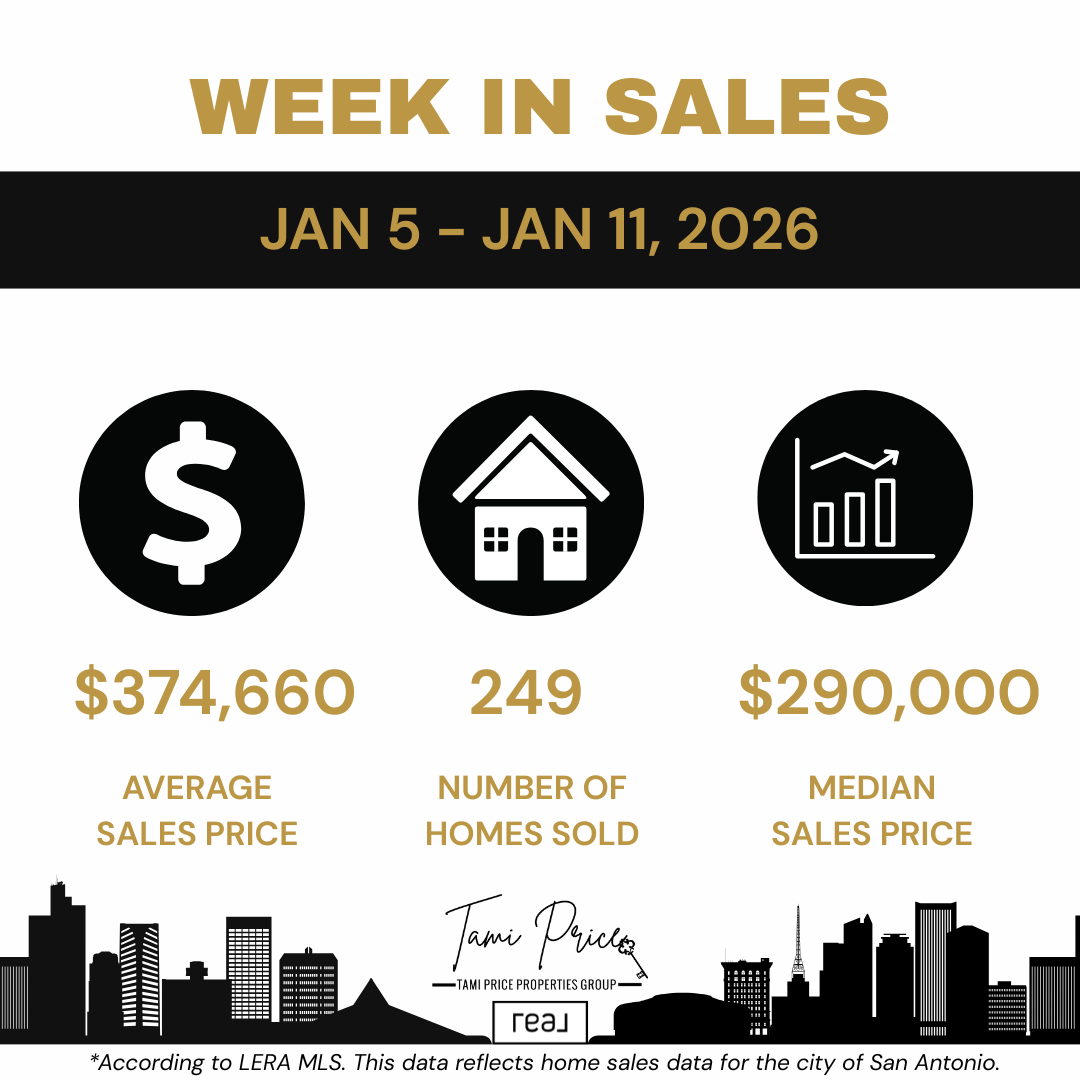
The following week, January 5 through January 11, 2026, showed a natural seasonal adjustment. San Antonio saw 249 homes sold, with an average sales price of $374,660 and a median sales price of $290,000. While the number of closed sales declined by approximately 47 percent week over week, pricing remained relatively stable.
Together, these weeks highlight an important pattern for buyers and sellers evaluating market conditions:
- Transaction volume dropped significantly as expected after holiday closing activity
- Average pricing remained stable with only a 0.7 percent decline between weeks
- Median pricing adjusted downward by 6.4 percent, indicating increased activity in more affordable price ranges
- Buyer activity continued despite seasonal slowdown, demonstrating sustained demand
This data reveals a market transitioning from year-end transaction completion to early-year recalibration. Buyer activity slowed after the holidays, but pricing did not collapse, suggesting that sellers maintain pricing power in correctly positioned listings while buyers gain negotiation flexibility in slower transaction environments.
Q: Why does the median sales price matter more than the average for most buyers and sellers?
A: The median represents the middle point where half of homes sold for more and half sold for less, making it less affected by extreme high-end or low-end sales. The average can be skewed by luxury transactions or distressed sales, so the median provides a more accurate reflection of typical market pricing.
How Does Post-Holiday Transaction Volume Impact Buyer Opportunities in San Antonio?
The 47 percent decline in closed sales between the December 29-January 4 week and the January 5-11 week reflects predictable seasonal behavior rather than fundamental market weakness. This pattern creates specific advantages for buyers entering the market in January and early February.
Fewer competing buyers typically translates to:
- Reduced multiple-offer situations on well-priced listings in desirable neighborhoods
- Increased negotiation leverage on price adjustments, closing cost assistance, and repair credits
- More time for due diligence during inspection periods without pressure to waive contingencies
- Greater inventory selection as listings remain active longer before receiving acceptable offers
- Seller motivation increases as days on market accumulate during slower transaction periods
For first-time buyers, military families relocating to Joint Base San Antonio, and move-up buyers evaluating neighborhood options, this seasonal window provides breathing room that often disappears during spring market acceleration.
Buyers who are prepared with financing pre-approval, clear property criteria, and realistic pricing expectations are better positioned to take advantage of this seasonal pattern. Homes that are priced correctly continue to sell, but the slower pace allows buyers more time to evaluate options without the pressure often seen in March through June.
Q: Should buyers wait until spring when inventory typically increases, or act now during the slower season?
A: Waiting for spring inventory means competing with significantly more buyers, often resulting in multiple offers and reduced negotiation leverage. Buying during the slower season provides competitive advantages that can offset slightly smaller inventory selection, particularly for buyers seeking value and favorable terms.
What Do These Pricing Trends Mean for Buyers Evaluating Affordability and Negotiation Strategy?
The median sales price declining from $309,990 to $290,000 between consecutive weeks indicates that more sales occurred in moderate and entry-level price ranges during the first full week of January. This shift reveals important insights for buyers across different market segments.
For buyers focusing on homes priced below $350,000, this data suggests:
- Increased inventory availability in starter home and move-up price ranges
- Active buyer competition in affordable segments despite overall market slowdown
- Pricing discipline required as sellers in this range often receive multiple inquiries even during slower periods
- Opportunity for value in listings that have accumulated days on market or price adjustments
For buyers evaluating homes above $400,000, the stable average pricing indicates:
- Consistent pricing expectations from sellers in mid to upper price ranges
- Selective buyer behavior requiring homes to demonstrate clear value propositions
- Negotiation opportunities on properties with extended market time or condition concerns
- Less competition from other buyers in higher price brackets during seasonal slowdowns
Understanding these price segment dynamics helps buyers structure offers that reflect current market positioning. Offering $10,000 below list price on a $275,000 home in a competitive neighborhood may be rejected quickly, while the same percentage reduction on a $450,000 home with 45 days on market may initiate productive negotiation.
Buyers benefit from working with representation that analyzes comparable sales within specific price ranges and neighborhoods rather than applying broad market generalizations to individual property negotiations.
Why Did Average Pricing Remain Stable While Median Pricing Declined Between These Two Weeks?
The average sales price declining only 0.7 percent ($377,186 to $374,660) while the median dropped 6.4 percent ($309,990 to $290,000) reveals important information about which price segments drove transaction activity during each week.
This divergence typically indicates:
- High-end sales maintained pricing power during the January 5-11 week, keeping the average elevated
- Volume shifted toward moderate pricing with more transactions closing below $300,000
- Luxury segment activity remained present despite overall transaction volume decline
- Entry-level and mid-market inventory moved as buyers focused on affordability and value
For buyers and sellers, this pattern suggests that San Antonio's market operates across multiple distinct segments with different dynamics. The luxury market may experience less seasonal volatility due to lower overall transaction volume and less time-sensitive buyers. The moderate and entry-level segments respond more directly to seasonal patterns, interest rate changes, and buyer urgency related to school schedules or relocation timelines.
Understanding these segment-specific behaviors prevents misapplication of broad market trends to specific pricing decisions. A seller listing a $650,000 home should not interpret the median price decline as indicative of their pricing environment, just as a buyer seeking a $280,000 home should not assume reduced competition based on overall transaction volume declines.
Q: How do I know which market segment my target home price falls into and what that means for my strategy?
A: Work with a REALTOR® who analyzes absorption rates, days on market, and list-to-sale price ratios within your specific price range and target neighborhoods. Market segments typically break around $250,000, $350,000, $500,000, and $750,000 in San Antonio, but neighborhood dynamics create variations within these general brackets.
What Should Sellers in San Antonio Understand About Pricing Strategy Based on These Early January Numbers?
For sellers, these numbers reinforce the importance of evidence-based pricing strategy rather than aspirational pricing based on peak market performance from previous quarters. While buyer activity slows in early January, demand does not disappear, and homes that are priced accurately continue to attract attention.
The consistency in average pricing between the two weeks ($377,186 versus $374,660) demonstrates that buyers remain willing to pay market value for homes that offer:
- Desirable locations in established neighborhoods with strong school districts, accessibility, and amenities
- Move-in condition requiring minimal immediate repairs or updates
- Competitive pricing aligned with recent comparable sales rather than aspirational market positioning
- Professional presentation through quality photography, staging, and marketing materials
However, buyers are increasingly selective during slower periods, and pricing above market expectations quickly leads to increased days on market, which compounds negotiation challenges and may ultimately require price reductions that fall below initial market value.
Sellers considering listing early in the year should focus on:
- Recent comparable sales from the past 30-45 days rather than peak pricing from six months ago
- Current active competition to understand how their home positions against available inventory
- Days on market trends in their price range and neighborhood to set realistic timeline expectations
- Condition assessment to identify repairs or improvements that justify pricing within the competitive set
Properties that enter the market overpriced during slower seasons often remain active into spring, at which point new inventory creates additional competition and the listing appears stale to buyers reviewing search results.
Q: If I list my home in January and it doesn't sell quickly, will I miss the spring market when more buyers are active?
A: If your home is priced correctly and well-presented, January listings often attract serious buyers with less competition. If initial pricing proves incorrect, early feedback allows time for adjustment before spring inventory increases. The risk is overpricing initially and carrying that mistake into a more competitive inventory environment.
How Do Seasonal Patterns in San Antonio's Market Create Strategic Opportunities?
Understanding seasonal patterns allows both buyers and sellers to time their decisions strategically. The data from late December and early January demonstrates predictable behavior that repeats annually with minor variations based on broader economic conditions.
Typical seasonal patterns in San Antonio include:
- January through February: Reduced transaction volume, less buyer competition, increased negotiation leverage for buyers, motivated sellers who list during slow periods
- March through June: Inventory increases, buyer activity accelerates, multiple-offer situations become common, sellers gain pricing power
- July through August: Summer heat and school schedules create brief slowdown, serious buyers with timing constraints remain active
- September through November: Fall activity rebound, motivated buyers and sellers completing transactions before holidays
- December: Transaction volume declines, holiday focus reduces showings, year-end closings create brief activity spike
Buyers who understand these patterns can strategically enter the market during low-competition windows. Sellers who recognize seasonal demand shifts can time listings to capture peak buyer activity or price competitively to attract motivated buyers during slower periods.
The key insight from the early January 2026 data is that seasonal slowdowns do not eliminate market activity—they shift the balance of negotiating power and require different strategies than peak season approaches.
What Role Does Weekly Market Data Play in Making Informed Real Estate Decisions?
Weekly sales data provides a more immediate view of market behavior than monthly or quarterly reports, which aggregate activity over longer periods and mask short-term momentum shifts. This granularity matters in markets like San Antonio where neighborhood-level variations and price segment differences create diverse conditions within the broader market.
Weekly data reveals:
- Transaction velocity changes indicating whether buyer urgency is increasing or decreasing
- Price trend direction before monthly aggregations confirm shifts that may have already changed
- Inventory absorption patterns showing how quickly new listings receive offers in specific segments
- Seasonal transition points that signal strategic timing for buyers and sellers
For example, if weekly sales data shows three consecutive weeks of declining transaction volume but stable pricing, buyers might interpret this as an opportunity window before spring acceleration. If pricing begins declining alongside volume, that pattern suggests different market dynamics requiring adjusted strategy.
Tami Price, REALTOR®, provides clients with weekly market analysis focused on their specific price ranges and target neighborhoods, ensuring that decisions reflect current conditions rather than generalized market headlines that may not apply to individual situations.
Q: How often does market data change enough to affect my buying or selling strategy?
A: Significant market shifts typically develop over 4-8 weeks as patterns become consistent. However, neighborhood-specific opportunities or challenges can emerge more quickly. Monitoring weekly data helps identify trend changes early rather than reacting after conditions have already shifted substantially.
How Should Buyers in Different Market Segments Approach the Current San Antonio Market?
The early January 2026 data reveals opportunities and challenges that vary by buyer type and price range. Strategic approaches should align with specific circumstances rather than generic market assumptions.
First-Time Buyers (typically $200,000-$325,000 range):
- Focus on pre-approval strength to compete in segments with sustained activity
- Prioritize neighborhoods offering growth potential over immediate perfection
- Consider slightly longer commutes or emerging areas to access better value
- Structure offers with reasonable contingencies rather than waiving protections
- Budget for potential repairs or updates in moderately priced inventory
Move-Up Buyers (typically $325,000-$550,000 range):
- Leverage existing home equity while maintaining contingent sale protection
- Evaluate timing to avoid holding two mortgages during market transitions
- Consider new construction options with builder incentives during slower periods
- Negotiate seller concessions for closing costs or rate buydowns
- Focus on long-term value in school districts and neighborhood amenities
Military Relocating to San Antonio (all price ranges):
- Understand VA loan benefits and how they position against conventional financing
- Research neighborhoods near Joint Base San Antonio for commute and community
- Consider VA loan assumption opportunities in current inventory
- Work with Military Relocation Professional (MRP) familiar with PCS timelines
- Evaluate both purchase and rental markets based on assignment duration
Luxury Buyers (above $550,000):
- Recognize that high-end segments experience less seasonal volatility
- Focus on unique property features and location rather than competing on price alone
- Negotiate from position of selective buyer during slower transaction periods
- Evaluate custom versus production builder options in new construction
- Consider longer due diligence periods for property condition and title review
Each segment requires different positioning, financing preparation, and negotiation approaches. The current market provides advantages for prepared buyers who understand their segment-specific dynamics.
Expert Insight from Tami Price, REALTOR® | San Antonio, TX
Tami Price has served the San Antonio real estate market for nearly two decades, completing approximately 1,000 transactions across diverse price ranges, neighborhoods, and buyer types. Her focus on data-driven market analysis helps clients separate market noise from actionable insight, ensuring that decisions reflect current conditions rather than assumptions based on past performance or generalized headlines.
As a USAF Veteran and Military Relocation Professional (MRP), Tami Price specializes in helping military families navigate PCS moves to Joint Base San Antonio, VA loan benefits, and the unique timing challenges that accompany military relocations. Her experience across multiple market cycles provides perspective on how seasonal patterns create opportunities for strategic buyers and sellers.
"Weekly market data tells you what's happening now, not what happened last quarter when conditions may have been completely different," Tami Price explains. "The late December and early January numbers reveal a market that's transitioning into its seasonal rhythm—buyer activity has slowed from the holiday rush, but pricing remains stable and opportunities exist for prepared buyers and strategically positioned sellers."
Her approach emphasizes preparation over speed and strategy over reaction. For buyers, this means entering the market with clear financing, realistic expectations, and understanding of how their target price range is performing relative to broader market trends. For sellers, it means pricing based on current comparable sales, preparing homes to compete effectively against active inventory, and recognizing that slower seasons require different marketing approaches than peak demand periods.
"The mistake I see buyers make is waiting for the 'perfect' market that never arrives," Tami Price notes. "The mistake sellers make is pricing based on what they want or need rather than what current buyers are willing to pay. The data doesn't lie—it shows you exactly what's working and what isn't if you're willing to look at it objectively."
Tami Price's recognition as a RealTrends Verified Top Agent and 15-time Five Star Professional® award winner reflects her commitment to combining market expertise with client-focused service. Whether buyers are navigating competitive segments or sellers are positioning listings during seasonal transitions, the goal remains consistent: informed decisions supported by current data and strategic guidance.
Three Key Takeaways: How Early January 2026 Market Data Should Inform Your Real Estate Decisions
1. Seasonal Transaction Volume Declines Create Buyer Advantages Without Pricing Collapse
The 47 percent decline in closed sales between late December and early January represents predictable seasonal behavior rather than market weakness. Transaction volume dropped from 473 homes to 249 homes, but average pricing declined only 0.7 percent, demonstrating that sellers maintain pricing expectations while facing fewer competing offers. For buyers, this creates a strategic window where reduced competition increases negotiation leverage on price adjustments, closing cost assistance, and repair credits without requiring sellers to accept below-market offers. This seasonal advantage typically lasts through February before spring inventory and buyer activity accelerate, making January and early February an opportune time for prepared buyers to act without multiple-offer pressure that characterizes peak seasons.
2. Median Price Shifts Reveal Activity Concentration in Affordable Segments
The median sales price declining 6.4 percent from $309,990 to $290,000 while average pricing remained stable indicates that transaction volume concentrated in entry-level and moderate price ranges during early January. This pattern suggests that buyers seeking affordability and value drove market activity, while luxury segments maintained pricing power with fewer overall transactions. For buyers targeting homes below $350,000, this means expecting continued competition even during seasonal slowdowns, requiring strong financing and realistic offers. For buyers evaluating higher price ranges, this suggests increased negotiation opportunities and seller flexibility as competition decreases in segments above median pricing. Understanding which segment your target price range occupies determines whether current conditions favor aggressive or patient approaches.
3. Weekly Data Provides Actionable Insight That Monthly Reports Miss
Monitoring weekly sales data rather than waiting for monthly or quarterly market reports allows buyers and sellers to identify trend changes and opportunity windows before broader market recognition shifts competitive dynamics. The transition from 473 weekly sales to 249 weekly sales happened over seven days, creating immediate strategic implications for pricing, timing, and negotiation that wouldn't appear in monthly aggregations until the pattern had already established. For buyers, weekly monitoring helps identify when seller motivation increases or when specific price ranges show absorption slowdowns. For sellers, it reveals when inventory competition decreases or when pricing adjustments become necessary before market positioning deteriorates. Real estate decisions involve significant financial commitments and timing considerations—weekly data provides the granularity necessary to make informed choices rather than reactive decisions based on outdated information.
Frequently Asked Questions About the San Antonio Real Estate Market in Early 2026
Q: Is the San Antonio real estate market slowing down significantly based on these numbers?
A: The transaction volume decline from 473 to 249 homes reflects normal seasonal patterns following holiday closings rather than fundamental market weakness. Average pricing remained stable at $374,660-$377,186, indicating that sellers maintain pricing power while transaction pace naturally slows during January. This represents market recalibration, not collapse.
Q: Should I wait to buy a home until prices drop further?
A: The median price decline from $309,990 to $290,000 reflects transaction concentration in more affordable price ranges rather than broad price reductions. Average pricing declined only 0.7 percent, suggesting minimal price movement. Waiting for significant price drops means potentially missing current negotiation opportunities and competing with more buyers when spring activity accelerates in March.
Q: What is causing fewer homes to sell in early January compared to late December?
A: Late December typically sees a surge of closings from transactions that began in October and November, with buyers and sellers pushing to complete before year-end for tax purposes, moving timelines, or personal reasons. Early January represents the natural post-holiday slowdown as new listings take time to attract buyers and negotiations extend closing dates into February and beyond.
Q: Are sellers dropping prices to attract buyers during this slower period?
A: The stable average pricing suggests that most sellers are maintaining list prices rather than making significant reductions. However, sellers who listed during peak fall months without adjusting prices as market velocity slowed are more likely to consider price reductions to generate renewed buyer interest during the slower season.
Q: How long does this seasonal slowdown typically last in San Antonio?
A: Transaction volume and buyer activity typically remain subdued through January and February before accelerating in March as spring market dynamics begin. However, serious buyers remain active throughout the slower period, and well-priced inventory continues to receive offers without the multiple-month market times that indicate true buyer absence.
Q: What neighborhoods in San Antonio are showing the strongest activity in early 2026?
A: Weekly market data does not typically break down to neighborhood-specific performance in publicly available reports. Working with a local REALTOR® provides access to MLS® data showing days on market, absorption rates, and pricing trends for specific neighborhoods, subdivisions, and zip codes based on current inventory and recent sales.
Q: Should sellers wait until spring to list homes instead of entering the market now?
A: Sellers who list during the slower season face less inventory competition and attract serious buyers rather than casual browsers. Spring inventory increases substantially, creating more competition for buyer attention. The strategic choice depends on individual circumstances, but correctly priced homes sell year-round, and early listings often receive offers from motivated buyers with less negotiation pressure.
Q: How do I know if my target price range is experiencing the same trends as the overall San Antonio market?
A: Overall market statistics mask significant variations across price segments and neighborhoods. The difference between median and average pricing in this data demonstrates that entry-level segments behaved differently than higher price ranges. Consult with a REALTOR® who analyzes your specific price range and target neighborhoods using recent comparable sales and active inventory data.
The Bottom Line: Using Current Market Data to Make Strategic Real Estate Decisions in San Antonio
The San Antonio real estate market has entered 2026 in a stable and balanced position, with transaction volume following predictable seasonal patterns while pricing remains consistent across most segments. Buyer activity has slowed from the post-holiday surge, but pricing stability demonstrates continued demand and seller confidence in current market valuations.
For buyers, the current environment offers reduced competition and increased negotiation leverage without requiring sellers to accept significantly below-market offers. The 47 percent decline in weekly transaction volume creates breathing room for due diligence, property evaluation, and offer structuring without the multiple-offer pressure that characterizes spring markets. Buyers who enter the market prepared with financing, realistic expectations, and clear property criteria can capitalize on this seasonal window before March and April bring renewed competition.
For sellers, the data reinforces the critical importance of evidence-based pricing strategy aligned with current comparable sales rather than aspirational market positioning from previous quarters. Average pricing remaining stable at $374,660-$377,186 demonstrates that buyers will pay market value for homes offering location, condition, and competitive positioning. However, seasonal slowdowns increase days on market for overpriced listings, creating negotiation challenges and potential price reductions that ultimately fall below initial market value. Sellers who price correctly and prepare homes professionally continue to receive offers and achieve successful closings even during traditionally slower periods.
Understanding weekly market data provides actionable insight that monthly reports cannot match, revealing momentum shifts and opportunity windows before broader market recognition changes competitive dynamics. Whether you are buying your first home in San Antonio, selling to relocate for work, moving up to accommodate a growing family, or coordinating a PCS move to Joint Base San Antonio, current market data should inform your strategy and timeline.
If you are considering buying or selling a home in San Antonio, Schertz, Cibolo, Helotes, Converse, or Boerne, working with a REALTOR® who monitors weekly market trends and provides segment-specific analysis ensures that your decisions reflect current conditions rather than outdated assumptions. Strategic guidance grounded in data creates competitive advantages regardless of whether markets favor buyers or sellers.
Contact Tami Price, REALTOR® | San Antonio, TX
Tami Price provides comprehensive real estate services across San Antonio and surrounding communities, specializing in data-driven market analysis, buyer representation, seller representation, military relocations, and strategic transaction guidance.
Phone: 210-620-6681
Email: tami@tamiprice.com
Website: www.tamiprice.com
Schedule a consultation to discuss your real estate goals: Book A Consultation
Search available properties: Property Search
Learn more about buying a home in San Antonio: How to Buy a Home in San Antonio: A Step-by-Step Local Guide
Explore selling strategies: Deciding to Sell Your San Antonio Home
Tami Price's Specialties
- Buyer and Seller Representation
- Military Relocations and PCS Moves
- VA Loan Guidance and VA Loan Assumptions
- New Construction
- First Time Home Buyers
- Move Up Buyers
- Downsizing and Rightsizing
- Strategic Pricing and Market Analysis
- San Antonio, Schertz, Cibolo, Helotes, Converse, and Boerne
Disclaimer
This blog is for informational purposes only and does not constitute legal, financial, or real estate advice. Market conditions change, and individual circumstances vary. Readers should consult qualified professionals before making real estate decisions. Tami Price, REALTOR®, is licensed in Texas and affiliated with Real Broker, LLC. Fair Housing principles apply to all content.
Categories
- All Blogs (678)
- Home Buying (1)
- Neighborhood Guides (26)
- About Tami Price (2)
- Affordable Housing & Community Development (3)
- Agent Qualifications and Credentials (1)
- Agent Qualifications and Experience (1)
- AI and Real Estate Tools (1)
- Alamo Heights (5)
- Alamo Heights Real Estate (1)
- Alamo Ranch (1)
- Amenities in Helotes, Texas (3)
- Apartment Market (1)
- Arts and Culture (1)
- Awards and Recognition (2)
- Best Neighborhoods to Live in Cibolo, TX (3)
- Best Neighborhoods to Live in San Antonio (16)
- Best Places to Live in Leon Valley: A Neighborhood Guide (1)
- Best Places to Live in Northeast Inner Loop: A Neighborhood Guide (1)
- Bexar County Property Tax (1)
- Bexar County Real Estate (1)
- Boerne Home Sellers (1)
- Boerne Neighborhoods (2)
- Boerne Texas (7)
- Broadway Corridor Development (1)
- Build-to-Rent Communities (1)
- Builder Contracts & Warranties (1)
- Builder Warranties (1)
- Buyer (95)
- Buyer and Seller Guidance (2)
- Buyer Due Diligence (1)
- Buyer Education (20)
- Buyer Guide (7)
- Buyer Protection Strategies (1)
- Buyer Representation (1)
- Buyer Representation Expertise (1)
- Buyer Resources (9)
- Buyers (1)
- Buying a Foreclosed Home in San Antonio (10)
- Buying a Home (1)
- Buying a Home in San Antonio (6)
- Castroville, TX (8)
- Central San Antonio (1)
- Central San Antonio Development (2)
- Central Texas Growth (1)
- Choosing a Real Estate Agent (1)
- Cibolo Home Sellers (1)
- Cibolo TX (14)
- Client Satisfaction (1)
- Client Testimonial (4)
- Clients review (4)
- Comal County (1)
- Commercial & Retail Development (26)
- Commercial Development (12)
- Commercial Development Impact on Home Values (1)
- Commercial Real Estate (1)
- Community Amenities (2)
- Community Development (23)
- Community Development and Real Estate (3)
- Community Events & Development (1)
- Community Infrastructure (1)
- Community Investment Impact (2)
- Community Landmarks (1)
- Community News (4)
- Community Planning (1)
- Community Revitalization (1)
- Commuter Neighborhoods (1)
- Cons of Living in Helotes, TX (4)
- Converse Home Sellers (1)
- Converse TX (10)
- Converse TX Real Estate (1)
- Cost of Living Guides (1)
- Cost of Living in San Antonio TX (25)
- CPS Energy Programs (1)
- Deco District San Antonio (1)
- Denver Heights (1)
- Down Payment Assistance (1)
- Downtown Boerne (1)
- Downtown Development (3)
- Downtown Living (1)
- Downtown Revitalization (14)
- Downtown San Antonio (2)
- Downtown San Antonio Real Estate (5)
- Downtown San Antonio Revitalization (1)
- East Side Neighborhoods (1)
- East Side San Antonio (4)
- Economic Development (3)
- Economic Growth & Industry (1)
- Education, Texas Hill Country (1)
- Employment (1)
- Employment Corridors (1)
- Entertainment Economy (1)
- Established Communities (3)
- Events in San Antonio (207)
- Expert Advice from Tami Price, Realtor® (9)
- Family Activities (2)
- Family Living in San Antonio (1)
- Far Northwest San Antonio (1)
- Far Westside Real Estate (4)
- Featured Properties (1)
- Financial Planning (1)
- First Time Buyers (2)
- First-Time Buyers (2)
- First-Time Homebuyer Resources (3)
- First-Time Homebuyer Tips (2)
- First-Time Homebuyers (5)
- First-Time Investors (1)
- Fort Sam Houston (2)
- Fort Sam Houston Real Estate (1)
- Fort Sam Houston, TX (2)
- FSBO vs Agent Representation (1)
- Gated Communities (2)
- Greater San Antonio Housing Trends (1)
- Greater San Antonio Real Estate (3)
- Green Home Upgrades (1)
- Healthcare (1)
- Helotes Home Sellers (1)
- Highway 151 Corridor Growth (1)
- Hill Country Business (1)
- Hill Country Communities (1)
- Hill Country Development (2)
- Hill Country Living (3)
- Hill Country Market Updates (1)
- Hill Country Real Estate (2)
- Historic Districts (1)
- Historic Neighborhoods (4)
- Historic Preservation (2)
- Holiday Attractions (1)
- Holiday Guide (1)
- Home Buying (7)
- Home Buying Guide (6)
- Home Buying Process (7)
- Home Buying Strategy (1)
- Home Buying Tips (3)
- Home Energy Efficiency San Antonio (1)
- Home Financing (2)
- Home Improvement ROI (1)
- Home Preparation (1)
- Home Pricing Strategy (3)
- Home Renovation for Resale (1)
- Home Selling (3)
- Home Selling Guide (5)
- Home Selling Strategies (2)
- Home Selling Strategy (1)
- Home Selling Tips (9)
- Home Staging and Updates (2)
- Home Values (1)
- Homebuyer Education (8)
- Homebuyer Resources (1)
- Homebuying Tips (3)
- Homeowner (35)
- Homeowner Tax Benefits (1)
- Homeownership Costs (1)
- Homes for Sale (1)
- Homes for sale near Lackland AFB (4)
- Homes Near Military Bases (1)
- Housing (1)
- Housing Community Development (1)
- Housing Development (2)
- Housing Market Updates (3)
- How to Buy a House in San Antonio TX (48)
- Huebner Oaks shopping center (1)
- I-10 Corridor (1)
- I-35 Corridor (1)
- Incorporated Cities (5)
- Industrial Investment Impact (1)
- Industry News (2)
- Infrastructure & Growth Projects (26)
- Infrastructure and Sustainability (1)
- Infrastructure Development (1)
- Infrastructure Investment (1)
- Infrastructure Updates (2)
- Interest Rates (1)
- Invest in San Antonio (46)
- Investment Opportunities (2)
- Investment Property San Antonio (1)
- JBSA (5)
- JBSA Real Estate (4)
- Joint Base San Antonio (5)
- Joint Base San Antonio Housing (1)
- La Cantera Retail Development (1)
- Lackland AFB (6)
- Lackland AFB Housing (1)
- Land Use Planning (1)
- Lera MLS (3)
- Lifestyle & Community Growth (18)
- Lifestyle & Local Growth (12)
- Lifestyle Amenities (1)
- Lifestyle Communities (1)
- Listing Preparation (1)
- Live Oak (1)
- Living in San Antonio, TX (52)
- Living Near Randolph AFB (5)
- Local Attractions (3)
- Local Business (1)
- Local Business & Development (9)
- Local Business & Economy (3)
- Local Business Spotlight (20)
- Local Business Support (5)
- Local Development (3)
- Local Development News (9)
- Local Market Insights (3)
- Local News (2)
- Local News Around San Antonio (2)
- Local Real Estate News (1)
- Loop 1604 Corridor Growth (2)
- Loop 410 Corridor Development (1)
- Luxury Communities (1)
- Luxury Retail San Antonio (1)
- Major Developments (2)
- Making Offers on Homes (1)
- Market Analysis (3)
- Market Conditions (12)
- Market Strategy (1)
- Market Timing (1)
- Market Trends (9)
- Market Update (6)
- Market Updates (9)
- Master Planned Communities (9)
- Medical Center Area Real Estate (1)
- Military & Economic Impact (3)
- Military Family Resources (1)
- Military Heritage (1)
- Military Homebuying (1)
- Military Housing (3)
- Military Housing Market in Texas (16)
- Military Life in San Antonio (2)
- Military Neighborhoods (1)
- Military PCS Relocations (3)
- Military Real Estate (2)
- Military Relocation (10)
- Military Relocation & VA Loans (9)
- Military Relocation San Antonio (4)
- Military Relocation Services (3)
- Military Relocation to San Antonio (50)
- Military Relocations (17)
- Military Relocations & VA Home Loans (5)
- Mixed-Income Housing (1)
- MLS Accuracy & Data Transparency (1)
- Mortgage Programs (1)
- Mothers Day in San Antonio (1)
- Move to Boerne TX (18)
- Move to Castroville TX (11)
- Move to Converse TX (16)
- Move to New Braunfels (1)
- Move to North San Antonio (19)
- Move to San Antonio TX (73)
- Move to Selma TX (19)
- Move to Shertz TX (13)
- Move to Texas (53)
- Move Up Buyers (1)
- Move-In Ready Homes (1)
- Move-In Ready Homes San Antonio (2)
- Move-Up Buyers (1)
- Moving to Helotes, TX (17)
- Moving to San Antonio (69)
- Neighborhood Amenities (1)
- Neighborhood Guides (7)
- Neighborhood Investment (1)
- Neighborhood News (2)
- Neighborhood Revitalization (2)
- Neighborhood Spotlights (11)
- Neighborhood Updates (1)
- Neighborhoods near Randolph AFB (12)
- New Braunfels (6)
- New Braunfels News (3)
- New Braunfels Real Estate (1)
- New Businesses (2)
- New Construction (26)
- New Construction Homes (9)
- New Construction Homes San Antonio (4)
- New Construction Without Customization (1)
- New Construction Without the Wait (1)
- New Development (3)
- New Listing (8)
- New Restaurants (3)
- News (211)
- News & updates (213)
- North Central San Antonio (5)
- North San Antonio (8)
- North San Antonio Real Estate (3)
- North Side Neighborhoods (1)
- North Side San Antonio Development (2)
- Northeast Inner Loop (1)
- Northeast Inner Loop Neighborhoods (1)
- Northeast San Antonio (3)
- Northwest San Antonio (6)
- Northwest San Antonio Development (1)
- Northwest San Antonio Growth (1)
- Northwest San Antonio Real Estate (1)
- Northwood (1)
- Olympia Hills (1)
- Parks and Recreation (2)
- PCS Guide (2)
- PCS Moves (2)
- PCS Moves to Joint Base San Antonio (2)
- PCS Planning (1)
- PCS Randolph AFB (17)
- PCS Relocation (1)
- PCS San Antonio (46)
- PCS to San Antonio (42)
- Pearl District Area Real Estate (2)
- Places to Eat Near Randolph AFB (1)
- Pre-Listing Preparation (2)
- Pre-Listing Process (1)
- Pricing and Marketing Strategy (1)
- Professional Awards and Achievements (1)
- Professional Real Estate Representation (1)
- Property Tax Exemptions Texas (1)
- Property Value Enhancement (1)
- pros and cons living in Converse TX (3)
- Pros and Cons Living in Selma TX (6)
- Pros and Cons of Living in Castroville, TX (4)
- Pros and Cons of Living in San Antonio (33)
- Purchase Negotiation (1)
- Quality of Life (1)
- Quick Close Real Estate (1)
- Randolph AFB Neighborhoods (1)
- Real Estate (1)
- Real Estate Agent Recognition (1)
- Real Estate Agent Selection (2)
- Real Estate Agent Value (1)
- Real Estate Consultation (1)
- Real Estate Finance (1)
- Real Estate Financing (1)
- Real Estate Impact (1)
- Real Estate Investment San Antonio (2)
- Real Estate Legal Issues (1)
- Real Estate Market Insights (2)
- Real Estate Market Trends (5)
- Real Estate Professional Designations (1)
- Real Estate Technology & Trends (2)
- Real Estate Tips and Guides (2)
- Real Estate Trends (4)
- RealTrends Verified (1)
- Regional Real Estate (2)
- Relocating to San Antonio (2)
- Relocation (1)
- Relocation Resources (2)
- Relocation to San Antonio (55)
- Rental Housing (1)
- Resale Properties (1)
- Retail Development (1)
- Retire in Boerne TX (11)
- Retire in San Antonio (37)
- SABOR (21)
- San Antonio Area Listings (1)
- San Antonio Business Growth (1)
- San Antonio Buyer Resources (2)
- San Antonio Communities (2)
- San Antonio Community Events (1)
- San Antonio Community News (1)
- San Antonio Data Center Development (1)
- San Antonio Development (5)
- San Antonio Development & East Side Real Estate (1)
- San Antonio Dining and Lifestyle (3)
- San Antonio East Side Development (1)
- San Antonio Employment Growth (1)
- San Antonio Food & Community Development (2)
- San Antonio Growth (8)
- San Antonio Home Buying and Selling (2)
- San Antonio Home Buying Guide (4)
- San Antonio Home Improvement (2)
- San Antonio Home Sellers (2)
- San Antonio Homeowner Guide (1)
- San Antonio Homeowner Resources (1)
- San Antonio Housing Market & Mortgage Financing (2)
- San Antonio Housing Market Analysis (1)
- San Antonio Housing Trends & Market Analysis (4)
- San Antonio Industrial Development (1)
- San Antonio Industrial Policy (1)
- San Antonio Investment Properties (2)
- San Antonio Job Market (1)
- San Antonio Lifestyle Amenities (1)
- San Antonio Listing (1)
- San Antonio Living (1)
- San Antonio Market (2)
- San Antonio Market Updates (13)
- San Antonio Military Relocation (2)
- San Antonio Neighborhoods (51)
- San Antonio New Construction & Master-Planned Communities (4)
- San Antonio New Home Communities (1)
- San Antonio News (229)
- San Antonio North Side Development (1)
- San Antonio Parks (1)
- San Antonio Property Investment (1)
- San Antonio Property Taxes (1)
- San Antonio Real Estate (49)
- San Antonio Real Estate Agents (2)
- San Antonio Real Estate Excellence (1)
- San Antonio Real Estate Guide (6)
- San Antonio Real Estate Market (33)
- San Antonio Real Estate Market Analysis (6)
- San Antonio Real Estate News (2)
- San Antonio Restaurant News (2)
- San Antonio Restaurant Openings (1)
- San Antonio Seller Resources (1)
- San Antonio Spec Homes (1)
- San Antonio Spurs Community Programs (1)
- San Antonio Suburbs (1)
- San Antonio Transportation (2)
- San Antonio University Area Housing (1)
- San Antonio Urban Living (7)
- San Antonio West Side Development (2)
- San Antonio Zoning Policy (1)
- Schertz Home Sellers (1)
- Schertz, TX (12)
- School Districts (1)
- Sell Home In San Antonio TX (62)
- Seller (83)
- Seller Education (11)
- Seller Guide (3)
- Seller Representation Expertise (1)
- Seller Resources (8)
- Seller Strategy (2)
- Seller Tips (1)
- Sellers (2)
- Selling A Home in San Antonio (60)
- Selling Your San Antonio Home (3)
- Selma TX (9)
- Single-Story Homes (1)
- South San Antonio Real Estate (1)
- South Side Economic Growth (1)
- South Side San Antonio (1)
- Southtown (1)
- Southwest San Antonio Real Estate (1)
- Spec Homes and Inventory Homes (1)
- Spurs Arena Project Marvel (1)
- Stone Oak Community News (5)
- Suburban Housing Growth (12)
- Suburban Living (1)
- Technology Growth (3)
- Technology Sector Growth (1)
- Terrell Hills (3)
- Texas Homestead Exemption (1)
- The Dominion Real Estate (1)
- The Rim Area Real Estate (1)
- Things to do in San Antonio TX (21)
- Things to do Near Randolph AFB (4)
- Time-Sensitive Home Buying (1)
- Tips for Buying New Construction (9)
- Tobin Hill Neighborhoods (2)
- Top Real Estate Agent in San Antonio (3)
- Tourism and Economic Development (1)
- Traders's Joe San Antonio (1)
- Transportation Infrastructure (1)
- Universal City (1)
- Urban Corridor Real Estate (1)
- Urban Development (5)
- Urban Living (2)
- Urban Neighborhoods (4)
- Urban Real Estate (1)
- Urban Renewal Projects (1)
- Urban Revitalization San Antonio (1)
- Utility Cost Reduction (1)
- UTSA Campus Development (1)
- VA Home Loan Benefits (2)
- VA Loan Assumptions (3)
- VA loan benefits (26)
- VA Loan Guidance (1)
- VA Loans (12)
- VA Loans and Military Benefits (2)
- VA Loans and Military Home Buying (2)
- VA Loans San Antonio (43)
- VET Benefits Living in San Antonio (3)
- Veterans Resources (1)
- Village Northwest (1)
- Walkable Communities (1)
- week in sales (24)
- Weekly Sales Report (25)
- West San Antonio (2)
- West San Antonio Development (1)
- West San Antonio Real Estate (3)
- West San Antonio Real Estate Market (2)
- West Side Infrastructure Planning (1)
- West Side Real Estate (1)
- West Side San Antonio (2)
Recent Posts