
San Antonio Real Estate Market Update: Weekly Sales Trends Mid to Late January 2026
The San Antonio real estate market continues to show steady movement as January 2026 progresses, with weekly sales data offering important insight into buyer activity, pricing behavior, and market direction that directly affects homeowners buying a home in San Antonio or selling a home in San Antonio. Looking closely at closed sales from mid to late January provides clarity for both buyers and sellers who want to make informed decisions based on real numbers rather than assumptions about where the market stands.
According to LERA MLS® data for the City of San Antonio, the weeks of January 12 through January 25, 2026, reflected an active market with shifting price dynamics and consistent buyer participation across multiple price ranges. Tami Price, REALTOR®, notes that week-to-week variations in average and median sales prices reveal how quickly market conditions respond to inventory composition, buyer selectivity, and pricing strategy. For homeowners evaluating whether to enter the market as buyers or sellers, understanding these micro-trends provides strategic advantage over relying on outdated monthly or quarterly summaries that miss critical shifts in real-time market behavior.
Why This Matters for San Antonio Home Buyers and Sellers
Weekly market data provides granular insight that monthly and quarterly reports cannot capture. When average prices shift by $34,000 and median prices adjust by $38,000 within a single week, these movements signal important changes in buyer behavior, inventory mix, and pricing effectiveness.
For buyers, weekly trends reveal whether competition is intensifying or softening in specific price ranges. For sellers, this data demonstrates how quickly the market responds when pricing does not align with current buyer expectations and inventory realities.
Understanding these patterns allows both buyers and sellers to make strategic decisions based on current conditions rather than assumptions formed during different market phases. The San Antonio market remains active, but activity does not guarantee uniform outcomes across all price points or property types.
What Did the San Antonio Market Data Show for the Week of January 12-18, 2026?
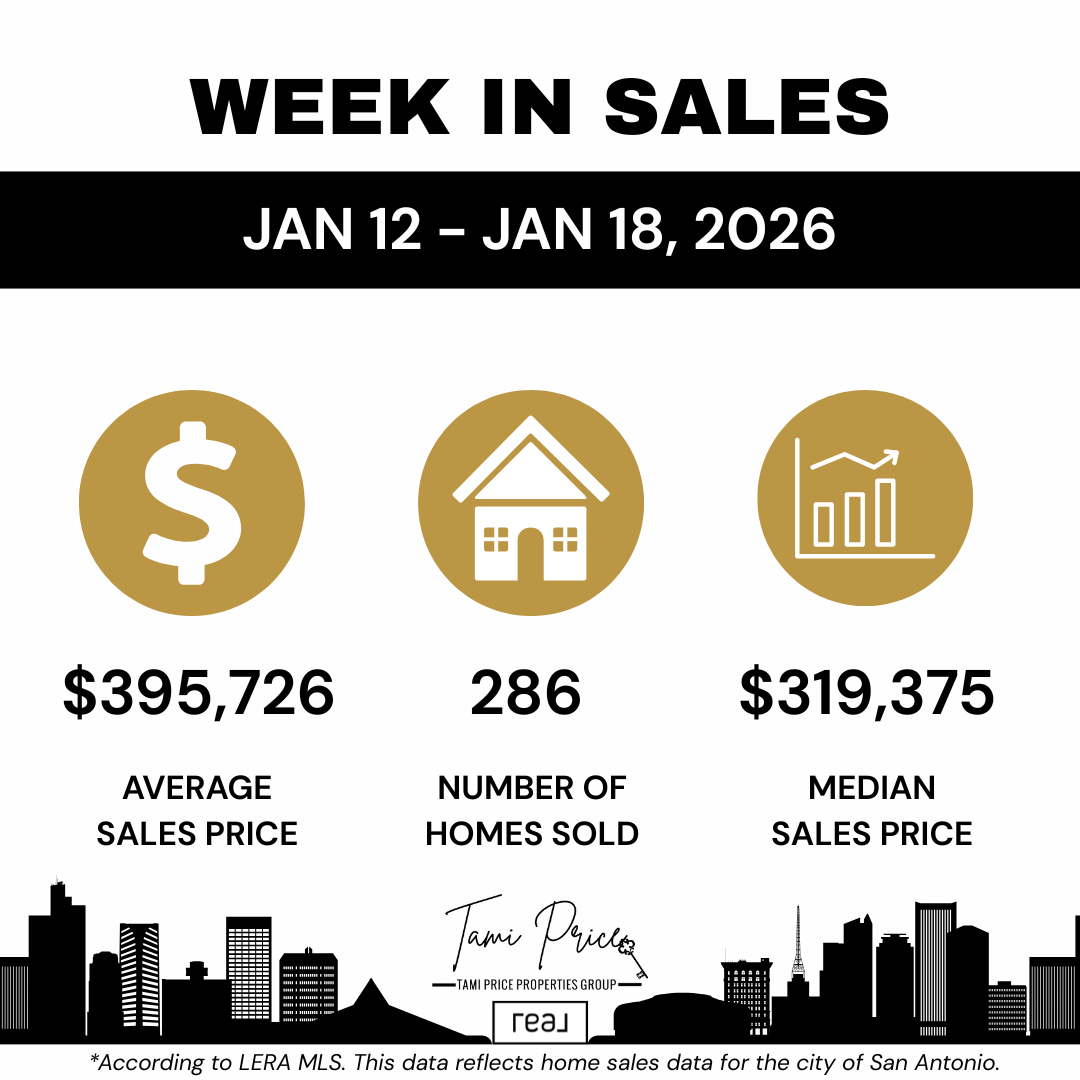
During the week of January 12 through January 18, 2026, San Antonio recorded 286 closed home sales according to LERA MLS® data. The average sales price reached $395,726, while the median sales price came in at $319,375.
This combination of metrics provides important context about market activity:
- Total closed sales of 286 homes indicates strong weekly transaction volume
- Average price of $395,726 reflects inclusion of higher-priced properties in the mix
- Median price of $319,375 shows the center point where half sold above and half below
- The gap between average and median suggests some higher-priced sales pulled the average upward
- Buyer activity was distributed across multiple price ranges, not concentrated in one segment
For sellers listing during this period, the data confirmed that buyers were willing to move forward when homes were positioned correctly. Properties priced in alignment with recent comparable sales and current buyer expectations continued to generate offers and reach closing.
For buyers competing during this week, the median price of $319,375 indicated that the center of market activity remained accessible to well-qualified buyers with appropriate financing. However, competition in popular neighborhoods and desirable price ranges required preparation and realistic expectations about available inventory.
Q: Why does the gap between average and median prices matter for buyers and sellers? A: A significant gap indicates that higher-priced sales are pulling the average upward while the median shows where the center of actual transaction activity sits. Sellers should focus on median prices in their specific price range rather than overall averages. Buyers can use this data to understand where competition is concentrated and whether inventory matches their budget.
The week's performance demonstrated that the San Antonio market remained functional across multiple price segments. Buyers with pre-approval, clear criteria, and willingness to act decisively when appropriate properties became available were successfully securing homes.
How Did Market Conditions Shift During the Week of January 19-25, 2026?
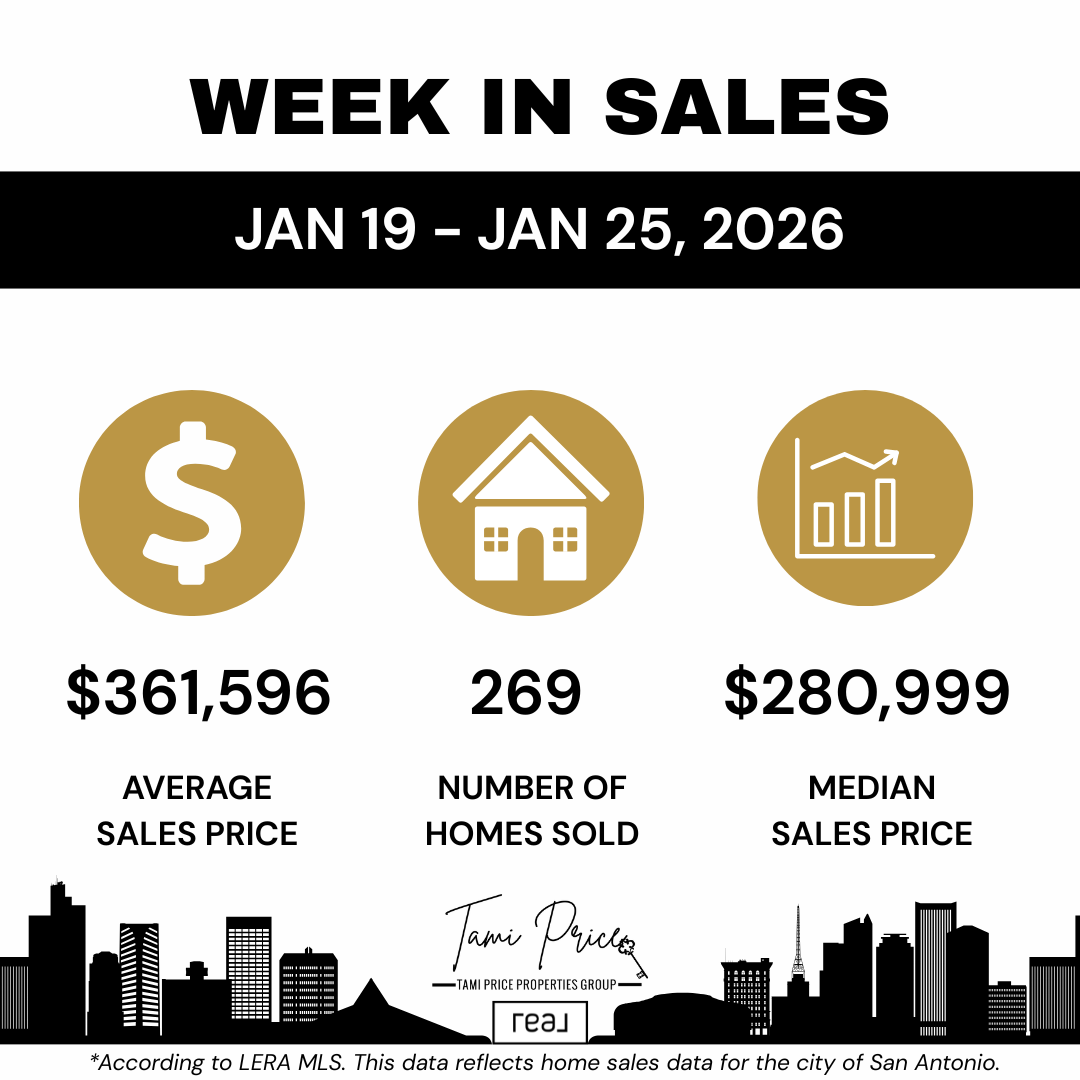
The following week saw 269 homes sold in San Antonio, representing a modest decrease in overall sales volume compared to the prior week. The average sales price adjusted to $361,596, and the median sales price declined to $280,999.
These shifts reflect several important market dynamics:
- Sales volume decreased by 17 transactions week over week
- Average price declined by $34,130 from the previous week
- Median price dropped by $38,376, a more significant percentage change
- The narrower gap between average and median suggests fewer high-priced sales
- Transaction activity shifted more heavily toward lower and mid-priced properties
This type of week-to-week movement reinforces that the market is active but not uniform. Pricing strategy, property condition, location advantages, and presentation quality continue to play major roles in determining outcomes.
For sellers, this data illustrates how quickly market response can change based on inventory composition and buyer selectivity. Homes priced aggressively or without recent comparable sales support face longer market times and reduced showing activity.
For buyers, the shift toward lower and mid-priced transactions indicates that value-conscious purchasing remains a priority. Buyers appeared more selective during this week, focusing on properties that demonstrated clear advantages in price, condition, or location relative to competing inventory.
Q: Does a weekly sales volume decrease signal a weakening market? A: Not necessarily. Weekly volume fluctuates based on closing schedules, inventory available during the prior contract period, and seasonal patterns. A 6% decrease is within normal variation. Focus on price trends and buyer selectivity patterns rather than single-week volume changes.
Understanding Price Sensitivity in Transitional Market Phases
The shift between these two consecutive weeks demonstrates a common pattern seen when markets transition between phases. While buyer activity remained steady, pricing showed increased sensitivity to how individual properties compared against available alternatives.
Buyers appeared more willing to wait for appropriately priced homes rather than competing aggressively for overpriced inventory. This behavior pattern benefits buyers who remain patient and disciplined, while creating challenges for sellers who miscalculate pricing strategy at the initial listing consultation.
What Do These Weekly Trends Mean for San Antonio Home Buyers?
For buyers watching the San Antonio market, these weekly shifts emphasize the importance of timing, preparation, and realistic expectations. Even within a single month, pricing trends can fluctuate based on inventory mix, buyer confidence, and available options at specific price points.
Strategic buyer positioning requires several key elements:
- Mortgage pre-approval that establishes clear purchasing power and credibility with sellers
- Understanding of current inventory in target neighborhoods and price ranges
- Willingness to act decisively when appropriately priced properties become available
- Realistic expectations about property condition, location, and compromise points
- Awareness that competition intensity varies significantly by price segment
Buyers who are pre-approved, understand their numbers, and focus on homes priced appropriately for current conditions are better positioned to navigate competition and avoid overextending financially. Weekly data like this also highlights why relying on outdated market narratives can lead to missed opportunities or unnecessary hesitation.
The median price shift from $319,375 to $280,999 within one week does not mean San Antonio home values dropped by 12%. Rather, it reflects which specific homes closed during each particular week. Buyers must understand that weekly data shows transaction composition, not value depreciation.
Q: Should buyers wait if median prices appear to be declining week over week? A: Weekly median price changes typically reflect inventory composition, not value trends. Waiting for prices to "drop further" often means missing well-priced properties that other informed buyers recognize as good value. Work with a knowledgeable REALTOR® who can help you evaluate whether specific properties represent fair value based on comparable sales, not weekly aggregate statistics.
Buyers working with Tami Price, REALTOR®, receive guidance on the home buying process in San Antonio that incorporates current weekly data alongside longer-term trend analysis. This comprehensive approach prevents reactionary decisions based on isolated data points while ensuring buyers understand genuine market shifts when they occur.
What Do These Weekly Trends Mean for San Antonio Home Sellers?
For sellers, this data confirms that buyers are still active but increasingly price-aware. Homes that are priced accurately based on recent comparable sales and presented well continue to sell, while overpricing can quickly impact visibility, showing activity, and ultimate market time.
The difference between the two weeks illustrates how quickly the market can respond when pricing does not align with current buyer expectations:
- Sellers who priced correctly during week one likely secured contracts and closed successfully
- Sellers who overpriced may have experienced reduced showing counts and minimal offer activity
- The shift toward lower-priced transactions shows buyers focusing on demonstrated value
- Properties lingering on market face increased competition from new listings priced aggressively
- Strategic pricing supported by data continues to outperform "test the market" approaches
Strategic pricing your San Antonio home requires analyzing recent comparable sales, current active inventory at similar price points, and buyer behavior patterns visible in weekly data. Sellers who understand these trends can better position their homes from the start, reducing the risk of extended days on market and price adjustments later.
Tami Price's approach to seller representation includes comprehensive pre-listing consultation that evaluates current weekly trends alongside seasonal patterns and neighborhood-specific data. This multi-layered analysis prevents pricing errors that damage market perception and reduce final proceeds.
How Weekly Data Informs Pricing Strategy
Monthly market reports show averages across 30 days of varying conditions. Weekly data reveals what happened during specific periods when similar properties competed directly against each other.
When sellers see that median prices shifted by nearly $40,000 in one week, the lesson is not that values are volatile. Rather, it demonstrates that pricing precision matters significantly when similar homes are available to buyers simultaneously.
Sellers who price $10,000 to $15,000 above recent comparable sales may find themselves competing against newer listings that learned from market feedback and priced more aggressively. This dynamic creates downward pressure that benefits disciplined buyers while punishing sellers who ignored initial pricing guidance.
Why Does Weekly Market Data Matter More Than Monthly Summaries?
Monthly and quarterly reports are useful for establishing long-term context and identifying seasonal patterns. However, weekly data provides a more immediate view of what buyers and sellers are actually doing right now, capturing subtle shifts that broader reports often miss.
Key advantages of weekly market analysis include:
- Real-time visibility into pricing effectiveness and buyer response patterns
- Early detection of inventory composition changes that affect competition
- Ability to identify whether specific weeks reflect anomalies or emerging trends
- Granular insight into how quickly market conditions respond to new inventory or external factors
- Strategic advantage for buyers and sellers making immediate decisions
By tracking weekly changes in sales volume, average prices, and median prices, buyers and sellers can respond to the market as it exists today, not as it existed months ago. This responsiveness creates competitive advantage for those willing to base decisions on current data rather than outdated assumptions.
For example, a seller who listed in early January based on December market data might have missed the shift visible in late January's weekly numbers. Similarly, a buyer who hesitated based on competitive conditions from two weeks prior might miss opportunities created by changing inventory composition.
Q: How many weeks of data should buyers and sellers review before making decisions? A: Examine at least 4-6 weeks of weekly data to distinguish genuine trends from statistical noise. Single-week anomalies happen regularly due to closing timing or unusual inventory composition. Multiple consecutive weeks showing similar patterns indicate real market shifts worth incorporating into strategy.
Weekly market updates from professionals who track LERA MLS® data closely provide actionable intelligence that general market commentary cannot match. Tami Price, REALTOR®, monitors these trends continuously and incorporates current weekly data into buyer consultations and seller pricing recommendations.
How Should Buyers and Sellers Interpret Week-to-Week Price Fluctuations?
Understanding what weekly price changes actually mean prevents misinterpretation that leads to poor strategic decisions. The shift from a $395,726 average to a $361,596 average does not indicate that San Antonio home values declined by 9% in seven days.
Instead, these changes reflect:
- Which specific properties happened to close during each particular week
- The mix of luxury, mid-range, and entry-level homes in each week's closing pool
- Timing of when contracts were signed weeks or months earlier
- Seasonal patterns in which price segments experience higher activity
- Random variation inherent in weekly sample sizes versus annual data
Buyers should not delay purchases hoping for continued "price drops" visible in weekly medians. Sellers should not panic when one week shows lower averages than the previous week. Both groups benefit from understanding context behind the numbers.
Professional interpretation of weekly data requires comparing:
- Current week performance against same week in prior years
- Multi-week trends rather than isolated data points
- Neighborhood-specific patterns versus citywide aggregates
- Price segment performance to identify where competition concentrates
- Contract volume leading indicators that predict future closing activity
This analytical framework transforms raw weekly statistics into strategic guidance that directly improves buyer and seller outcomes.
What Role Does Inventory Composition Play in Weekly Price Variations?
Weekly average and median prices fluctuate significantly based on which homes close during any particular seven-day period. If more luxury properties close one week, the average rises. If more entry-level homes close the following week, the average falls.
This inventory composition effect explains much of the week-to-week variation visible in San Antonio market data. Consider these scenarios:
Week One Inventory Composition:
- Ten luxury homes priced $600,000-$900,000 close escrow
- Thirty mid-range homes priced $300,000-$450,000 close escrow
- Fifteen entry-level homes priced $200,000-$280,000 close escrow
- Result: Higher average and median prices for that week
Week Two Inventory Composition:
- Three luxury homes priced $600,000-$900,000 close escrow
- Twenty mid-range homes priced $300,000-$450,000 close escrow
- Thirty entry-level homes priced $200,000-$280,000 close escrow
- Result: Lower average and median prices despite no actual value changes
Neither week indicates rising or falling home values. Both reflect normal variation in which properties reached closing during specific timeframes based on when contracts were signed weeks or months earlier.
Buyers and sellers working with experienced San Antonio REALTOR® representation receive context that prevents misinterpreting this data. Understanding inventory composition effects allows focus on genuine market signals rather than statistical noise.
Expert Insight from Tami Price
With nearly two decades representing San Antonio buyers and sellers and approximately 1,000 closed transactions, Tami Price, REALTOR®, understands that weekly market data provides valuable strategic intelligence when interpreted correctly. Her approach combines current weekly trends with seasonal patterns, neighborhood-specific analysis, and individual client circumstances.
"Weekly sales data gives us real-time visibility into market response that monthly summaries cannot capture," Tami explains. "When I see median prices shift by nearly $40,000 between consecutive weeks, I know that reflects inventory composition, not value volatility. But that same data tells me which price segments are experiencing strongest activity and where buyers are concentrating their offers."
Tami holds multiple designations including Pricing Strategy Advisor (PSA), Seller Representative Specialist (SRS), Accredited Buyer's Representative (ABR), and Graduate REALTOR® Institute (GRI). These certifications reflect ongoing education in pricing strategy, market analysis, and buyer psychology.
Her experience across multiple market cycles provides perspective on how weekly trends fit within longer-term patterns. Whether markets favor buyers or sellers, strong or soft, the fundamental principles remain consistent: accurate pricing drives results for sellers, and informed decision-making protects buyers from overpaying or missing opportunities.
"The weeks of January 12-18 and January 19-25 demonstrate perfectly why pricing strategy cannot rely on outdated assumptions," Tami notes. "Sellers who listed during week one at prices supported by recent comparable sales likely secured contracts and closed successfully. Sellers who overpriced based on what the market supported three months ago probably experienced disappointing showing activity and minimal buyer interest."
This commitment to data-driven guidance has earned Tami recognition as a RealTrends Verified Top Agent and 15-time Five Star Professional® Award winner, with more than 650 five-star reviews from buyers and sellers who valued her transparent, evidence-based approach to market positioning.
Three Key Takeaways
- Weekly market data reveals real-time buyer behavior and pricing effectiveness that monthly summaries cannot capture, providing strategic advantage for informed buyers and sellers. The January 12-18 week showed 286 closed sales with a median price of $319,375, while the January 19-25 week saw 269 sales with a median of $280,999. This $38,376 shift does not indicate declining home values but rather reflects which specific properties closed during each period. Buyers and sellers who understand this distinction avoid misinterpreting statistical noise as genuine market trends. Working with a REALTOR® who monitors weekly data and provides context prevents reactive decisions based on isolated data points while ensuring you recognize legitimate market shifts when they occur.
- Price sensitivity increases in transitional market phases, making accurate initial pricing more critical for sellers while creating opportunities for disciplined buyers. The shift from higher average prices in week one to lower averages in week two demonstrates how quickly markets respond when pricing does not align with buyer expectations and available inventory. Sellers who overprice even modestly face reduced showing activity and extended market time as buyers focus on properties demonstrating clear value advantages. Buyers who remain patient and selective benefit from this dynamic, securing well-priced homes while overpriced inventory languishes. Strategic positioning based on current weekly trends outperforms both aggressive overpricing by sellers and fearful hesitation by buyers.
- Inventory composition drives week-to-week price fluctuations more than actual value changes, requiring professional interpretation to extract meaningful strategic guidance. When more luxury properties close during a specific week, average and median prices rise. When more entry-level homes close the following week, these metrics fall. Neither scenario indicates that San Antonio home values appreciated or depreciated within seven days. Understanding this inventory composition effect prevents buyers from delaying purchases hoping for continued "price drops" and prevents sellers from panicking when one week shows lower statistics than the previous period. Professional market analysis distinguishes genuine trends requiring strategic response from normal statistical variation that should be ignored.
Frequently Asked Questions
Q: How reliable is weekly market data compared to monthly or quarterly reports? A: Weekly data is highly reliable for understanding current transaction activity but requires proper interpretation. Weekly samples are smaller than monthly aggregates, making individual weeks more susceptible to composition effects. However, weekly data captures real-time market response that monthly summaries average away. The key is examining multiple consecutive weeks to identify genuine trends versus single-week anomalies. Professional guidance helps distinguish meaningful patterns from statistical noise.
Q: Should buyers delay purchasing if weekly median prices appear to be declining? A: No. Weekly median price changes typically reflect which specific homes closed during particular periods, not value depreciation. Waiting for prices to "drop further" often means missing well-priced properties that other informed buyers recognize as good value. Focus on whether individual properties represent fair value based on recent comparable sales in specific neighborhoods, not citywide weekly aggregates. Competition for well-priced homes remains strong regardless of weekly median fluctuations.
Q: How should sellers use weekly data when determining initial list price? A: Weekly data should inform pricing strategy as one component alongside recent comparable sales, current active inventory, and neighborhood-specific trends. If weekly data shows median prices concentrating in specific ranges, price your home to compete effectively within the relevant segment. Avoid overpricing based on occasional high-priced sales that pull averages upward. Your REALTOR® should analyze which homes are actually selling week to week and price your property to attract the buyer pool demonstrating consistent activity.
Q: What causes average and median prices to diverge significantly in weekly data? A: Large gaps between average and median indicate that higher-priced sales are pulling the average upward while the median shows where the center of transaction activity actually sits. A few luxury closings can significantly raise the average without affecting the median. This divergence reveals market composition: if you're buying or selling in the median price range, focus on median statistics and comparable sales in your segment rather than averages skewed by luxury transactions.
Q: How many weeks of declining sales volume indicates a weakening market? A: Four to six consecutive weeks of declining volume combined with increasing inventory and longer days on market suggest genuine weakening. One or two weeks of lower volume often reflects closing timing, holiday disruptions, or normal variation. Examine trends alongside inventory growth rates and buyer activity indicators like showing counts and contract volume. Professional market analysis considers multiple data points rather than isolated metrics.
Q: Can weekly data predict future market direction reliably? A: Weekly data reveals current conditions and immediate trends but cannot predict long-term market direction reliably. External factors like interest rate changes, employment shifts, or economic disruptions affect future markets in ways weekly sales data cannot forecast. Use weekly data to understand present market behavior and make informed decisions about current opportunities, not to time markets or predict future pricing. Focus on whether individual properties meet your needs at fair current value.
Q: Should sellers adjust pricing if the week after listing shows lower market medians? A: Not based solely on one week's aggregate data. Evaluate your specific showing activity, buyer feedback, and how your home compares to recently sold properties in your neighborhood and price range. If showing counts are strong and feedback is positive, one week's lower citywide median is irrelevant. If showing activity is weak and feedback indicates pricing concerns, review comparable sales with your REALTOR® regardless of weekly aggregate statistics.
Q: How does weekly data help buyers competing in multiple offer situations? A: Weekly data showing strong sales volume and rising medians in your target price range indicates robust competition requiring aggressive but not reckless offers. Weekly data showing declining volume and lower medians suggests reduced urgency and potential negotiating leverage. However, individual property circumstances matter more than aggregate trends. A well-priced home in a desirable neighborhood will attract multiple offers regardless of overall weekly statistics. Your REALTOR® should help you evaluate specific competition for individual properties, not just general market trends.
The Bottom Line
The San Antonio real estate market remains active as January 2026 progresses, with steady sales and noticeable pricing shifts from week to week that provide valuable strategic intelligence for informed buyers and sellers. The weeks of January 12-18 and January 19-25 demonstrated that buyers are engaged but increasingly selective, focusing on properties that demonstrate clear value advantages in price, condition, or location.
For sellers deciding to sell your San Antonio home, weekly data confirms that accurate initial pricing based on recent comparable sales and current inventory continues to drive results. Overpricing creates measurable disadvantages including reduced showing activity, extended market time, and eventual price reductions that could have been avoided through informed initial positioning.
For buyers evaluating homes for sale in San Antonio, weekly trends reveal that patient discipline and financial preparation create competitive advantages. Buyers who secure pre-approval, understand their target price range, and act decisively when appropriately priced properties become available successfully navigate market conditions regardless of short-term weekly fluctuations.
Understanding current market conditions requires more than headlines, assumptions, or outdated monthly summaries. It requires examining real data week by week, distinguishing genuine trends from statistical noise, and applying that intelligence to individual goals and timelines. Working with a top real estate agent in San Antonio who tracks these trends closely and provides professional interpretation creates meaningful strategic advantage.
Ready to discuss how current San Antonio market trends affect your specific buying or selling timeline? Contact Tami Price, REALTOR®, for data-driven guidance grounded in weekly market intelligence and nearly two decades of experience representing buyers and sellers throughout San Antonio, Schertz, Cibolo, Helotes, Converse, and Boerne.
Contact Tami Price, REALTOR® | San Antonio, TX
Tami Price provides expert buyer and seller representation throughout Greater San Antonio with comprehensive market analysis incorporating weekly trends, seasonal patterns, and neighborhood-specific data. Schedule a consultation to discuss your real estate goals with guidance grounded in current market realities.
Phone: 210-620-6681
Email: tami@tamiprice.com
Website: www.tamiprice.com
Book a Consultation: Schedule Your Free Consultation
Tami Price's Specialties
- Buyer and Seller Representation
- Military Relocations and PCS Moves
- VA Loan Guidance and VA Loan Assumptions
- New Construction Representation
- First Time Home Buyers
- Move Up Buyers
- Downsizing and Rightsizing
- Strategic Pricing and Market Analysis
- San Antonio, Schertz, Cibolo, Helotes, Converse, and Boerne
Disclaimer
This blog is for informational purposes only and does not constitute legal, financial, or real estate advice. Market conditions change, and individual circumstances vary. Readers should consult qualified professionals before making real estate decisions. Tami Price, REALTOR®, is licensed in Texas and affiliated with Real Broker, LLC. Fair Housing principles apply to all content.
Categories
- All Blogs (911)
- Home Buying (10)
- Neighborhood Guides (44)
- 10 Military Neighborhood (1)
- 10 Mistakes Sellers Make (1)
- 10 Strategies to Coordinate a Same Day Close (1)
- 12 Lifestyle Questions to Move In (1)
- 12 Photos and Marketing Assets (1)
- 15 Red Flags Touring Home in San Antonio (1)
- 2026 Market (1)
- 7 Offer Terms Beyond Price (1)
- 78015 Ranked One (1)
- 8 Bridge (1)
- 8 Myths Buyers Believe about Down Payments (1)
- 8 Reasons VA Buyers Love New Construction (1)
- 9 Questions to Decide If You Keep Your PCS Home (1)
- 9 Timeline Questions Every Buyer Need to Ask (1)
- 9 Ways to Attract VA & Military Buyers (1)
- About Tami Price (5)
- Affordable Communities (2)
- Affordable Housing & Community Development (5)
- Agent Qualifications and Credentials (1)
- Agent Qualifications and Experience (1)
- Agent Recognition (2)
- Agent Selection (1)
- AI and Real Estate Tools (1)
- Alamo Heights (5)
- Alamo Heights ISD (1)
- Alamo Heights Real Estate (1)
- Alamo Ranch (2)
- Amenities in Helotes, Texas (3)
- Apartment Market (1)
- Appraisals (1)
- Arts and Culture (1)
- Awards and Recognition (5)
- Balcones Creek (1)
- Best Neighborhoods to Live in Cibolo, TX (3)
- Best Neighborhoods to Live in San Antonio (16)
- Best Places to Live in Leon Valley: A Neighborhood Guide (1)
- Best Places to Live in Northeast Inner Loop: A Neighborhood Guide (1)
- Bexar County Property Tax (1)
- Bexar County Real Estate (3)
- Boerne Home Sellers (1)
- Boerne Neighborhoods (2)
- Boerne Texas (9)
- Broadway Corridor Development (1)
- Build-to-Rent Communities (1)
- Builder Contracts & Warranties (3)
- Builder Incentives (1)
- Builder Warranties (1)
- Buyer (97)
- Buyer Activity San Antonio (1)
- Buyer and Seller Guidance (4)
- Buyer Due Diligence (1)
- Buyer Education (46)
- Buyer Guide (9)
- Buyer Guides (7)
- Buyer Protection Strategies (1)
- Buyer Representation (1)
- Buyer Representation Expertise (1)
- Buyer Resources (80)
- Buyer Strategy (2)
- Buyers (13)
- Buyers Agent (1)
- Buying a Foreclosed Home in San Antonio (10)
- Buying a Home (2)
- Buying a Home in San Antonio (6)
- Buying Timeline (1)
- Castroville, TX (8)
- Central San Antonio (1)
- Central San Antonio Development (2)
- Central Texas Growth (1)
- Choosing a Real Estate Agent (1)
- Choosing an Agent (1)
- Cibolo Communities (1)
- Cibolo Home Sellers (1)
- Cibolo TX (15)
- Client Reviews and Testimonials (1)
- Client Satisfaction (1)
- Client Stories (1)
- Client Testimonial (4)
- Clients review (4)
- Cobblestone (1)
- Comal County (1)
- Commercial & Retail Development (27)
- Commercial Development (13)
- Commercial Development Impact on Home Values (1)
- Commercial Real Estate (1)
- Community (1)
- Community Amenities (2)
- Community Development (23)
- Community Development and Real Estate (3)
- Community Events & Development (1)
- Community Infrastructure (1)
- Community Investment Impact (2)
- Community Landmarks (1)
- Community News (4)
- Community Planning (2)
- Community Revitalization (1)
- Community Spotlights (1)
- Commuter Neighborhoods (1)
- Cons of Living in Helotes, TX (4)
- Conservation Communities (1)
- Contingency Questions (1)
- Converse Home Sellers (1)
- Converse Homes For Sale (3)
- Converse Real Estate (1)
- Converse TX (10)
- Converse TX Real Estate (1)
- Cost of Living Guides (1)
- Cost of Living in San Antonio TX (25)
- CPS Energy Programs (1)
- Custom Homes (5)
- Days on Market (1)
- Deco District San Antonio (1)
- Denver Heights (1)
- Down Payment Assistance (1)
- Downtown Boerne (1)
- Downtown Development (3)
- Downtown Living (1)
- Downtown Revitalization (14)
- Downtown San Antonio (2)
- Downtown San Antonio Real Estate (5)
- Downtown San Antonio Revitalization (1)
- East Side Living (1)
- East Side Neighborhoods (1)
- East Side San Antonio (4)
- Economic Development (3)
- Economic Growth & Industry (1)
- Education, Texas Hill Country (1)
- Emerald Pointe (1)
- Employment (1)
- Employment Corridors (1)
- Encino Forest (1)
- Entertainment Economy (1)
- Equity and Pricing Strategy (2)
- Equity Q&A (1)
- Established Communities (3)
- Events in San Antonio (207)
- Expert Advice from Tami Price, Realtor® (10)
- Fair Oak Ranch (1)
- Family Activities (2)
- Family Homes (3)
- Family Living in San Antonio (1)
- FAQ (1)
- Far Northwest San Antonio (1)
- Far West San Antonio (1)
- Far Westside Real Estate (4)
- Fastest Growing Zip Codes in America (1)
- Featured Homes for Sale (2)
- Featured Properties (1)
- Financial Planning (7)
- Financing Strategy (1)
- First Time Buyers (21)
- First Time Sellers (1)
- First-Time Buyers (6)
- First-Time Homebuyer Resources (4)
- First-Time Homebuyer Tips (2)
- First-Time Homebuyers (6)
- First-Time Investors (1)
- Fort Sam Houston (3)
- Fort Sam Houston Real Estate (1)
- Fort Sam Houston, TX (2)
- Fox Grove (1)
- FSBO vs Agent Representation (1)
- Gated Communities (5)
- Golf Communities (1)
- Great Northwest (1)
- Greater San Antonio Housing Trends (2)
- Greater San Antonio Real Estate (5)
- Green Home Upgrades (1)
- Growth and Development (11)
- Healthcare (1)
- HELOC (1)
- Helotes Home Sellers (1)
- Highway 151 Corridor Growth (1)
- Hill Country Business (1)
- Hill Country Communities (2)
- Hill Country Development (3)
- Hill Country Homes for Sale (1)
- Hill Country Living (3)
- Hill Country Market Updates (1)
- Hill Country Real Estate (4)
- Historic Districts (5)
- Historic Neighborhoods (4)
- Historic Preservation (2)
- Holiday Attractions (1)
- Holiday Guide (1)
- Home Buying (7)
- Home Buying Education (3)
- Home Buying Guide (7)
- Home Buying Process (8)
- Home Buying Strategy (2)
- Home Buying Tips (6)
- Home Energy Efficiency San Antonio (3)
- Home Financing (2)
- Home Improvement ROI (1)
- Home Inspections (1)
- Home Preparation (2)
- Home Pricing Strategy (13)
- Home Renovation for Resale (1)
- Home Selling (8)
- Home Selling Guide (10)
- Home Selling Strategies (3)
- Home Selling Strategy (3)
- Home Selling Tips (22)
- Home Staging and Updates (2)
- Home Values (2)
- Homebuyer Education (15)
- Homebuyer Resources (1)
- Homebuying Guide (1)
- Homebuying Tips (3)
- Homeowner (35)
- Homeowner Tax Benefits (1)
- Homeownership Costs (1)
- Homes for Sale (2)
- Homes for sale near Lackland AFB (4)
- Homes Near Military Bases (1)
- Homestead amenities (1)
- Horizon Pointe (1)
- House Hunting Guide (1)
- Housing (1)
- Housing Community Development (1)
- Housing Development (2)
- Housing Market Updates (3)
- How to Buy a House in San Antonio TX (48)
- Huebner Oaks shopping center (1)
- Hunters Ranch (1)
- I-10 Corridor (1)
- I-35 Corridor (1)
- Incorporated Cities (6)
- Industrial Investment Impact (1)
- Industry News (2)
- Industry Recognition (1)
- Infrastructure & Growth Projects (26)
- Infrastructure and Sustainability (1)
- Infrastructure Development (1)
- Infrastructure Investment (1)
- Infrastructure Updates (2)
- Interest Rates (2)
- Invest in San Antonio (46)
- Investment Opportunities (2)
- Investment Property San Antonio (4)
- JBSA (9)
- JBSA Housing (11)
- JBSA Real Estate (4)
- JBSA Resources (7)
- Joint Base San Antonio (5)
- Joint Base San Antonio Housing (1)
- Judson ISD (2)
- Kendall County (1)
- La Cantera Retail Development (1)
- Lackland AFB (7)
- Lackland AFB Housing (1)
- Land Conservation (1)
- Land Use Planning (1)
- Lera MLS (14)
- Lifestyle & Community Growth (18)
- Lifestyle & Local Growth (12)
- Lifestyle Amenities (1)
- Lifestyle Communities (1)
- Listing Preparation (1)
- Listing Strategy (1)
- Live Oak (1)
- Living in San Antonio, TX (52)
- Living Near Randolph AFB (7)
- Loan Programs (1)
- Local Attractions (3)
- Local Business (1)
- Local Business & Development (9)
- Local Business & Economy (3)
- Local Business Spotlight (20)
- Local Business Support (5)
- Local Development (4)
- Local Development News (9)
- Local Market Insights (5)
- Local News (2)
- Local News Around San Antonio (2)
- Local Policy Changes (1)
- Local Real Estate News (1)
- Loop 1604 Corridor Growth (2)
- Loop 410 Corridor Development (1)
- Luxury Communities (3)
- Luxury Homes (2)
- Luxury Real Estate (1)
- Luxury Retail San Antonio (1)
- MacArthur Park (1)
- Major Developments (2)
- Making Offers on Homes (1)
- Market Analysis (26)
- Market Conditions (45)
- Market Expertise (1)
- Market Insights (5)
- Market Strategy (1)
- Market Timing (2)
- Market Trends (10)
- Market Trends & Insights (2)
- Market Update (15)
- Market Update 2026 (1)
- Market Updates (20)
- Master Planned Communities (12)
- Medical Center Area Real Estate (1)
- Medina Valley ISD (2)
- Midtown Living (1)
- Military & Economic Impact (3)
- Military Buyers (2)
- Military Communities (1)
- Military Families (1)
- Military Family Resources (1)
- Military Heritage (1)
- Military Homebuying (2)
- Military Homeownership (1)
- Military Housing (3)
- Military Housing Market in Texas (16)
- Military Life in San Antonio (2)
- Military Neighborhoods (1)
- Military PCS Relocations (3)
- Military Real Estate (2)
- Military Relocation (88)
- Military Relocation & VA Loans (9)
- Military Relocation San Antonio (4)
- Military Relocation Services (3)
- Military Relocation to San Antonio (50)
- Military Relocations (18)
- Military Relocations & VA Home Loans (5)
- Mixed-Income Housing (1)
- MLS Accuracy & Data Transparency (1)
- Mortgage Programs (1)
- Mothers Day in San Antonio (1)
- Move to Boerne TX (18)
- Move to Castroville TX (11)
- Move to Converse TX (16)
- Move to New Braunfels (1)
- Move to North San Antonio (19)
- Move to San Antonio TX (73)
- Move to Selma TX (19)
- Move to Shertz TX (13)
- Move to Texas (53)
- Move Up Buyer Resources (1)
- Move Up Buyers (19)
- Move-In Ready Homes (3)
- Move-In Ready Homes San Antonio (2)
- Move-Up Buyers (2)
- Moving to Helotes, TX (17)
- Moving to San Antonio (69)
- MUD Taxes (1)
- Natalia Homes For Sale (1)
- Near East Side Living (1)
- Negotiation Strategy (2)
- Neighborhood Amenities (1)
- Neighborhood Development (1)
- Neighborhood Guides (7)
- Neighborhood Investment (1)
- Neighborhood News (2)
- Neighborhood Revitalization (2)
- Neighborhood Spotlights (12)
- Neighborhood Updates (1)
- Neighborhoods near Randolph AFB (12)
- New Braunfels (6)
- New Braunfels Homes For Sale (1)
- New Braunfels News (3)
- New Braunfels Real Estate (3)
- New Businesses (2)
- New Construction (55)
- New Construction Communities (1)
- New Construction Homes (13)
- New Construction Homes San Antonio (5)
- New Construction vs Resale (1)
- New Construction Without Customization (1)
- New Construction Without the Wait (1)
- New Contruction Cost (1)
- New Development (3)
- New Listing (18)
- New Restaurants (3)
- News (211)
- News & updates (213)
- No HOA Homes (1)
- North Central San Antonio (5)
- North East ISD (3)
- North San Antonio (9)
- North San Antonio Real Estate (3)
- North Side Neighborhoods (1)
- North Side San Antonio Development (2)
- Northeast Inner Loop (1)
- Northeast Inner Loop Neighborhoods (1)
- Northeast San Antonio (3)
- Northside ISD (4)
- Northwest San Antonio (9)
- Northwest San Antonio Development (1)
- Northwest San Antonio Growth (1)
- Northwest San Antonio Real Estate (3)
- Northwood (1)
- Olympia Hills (1)
- One-Story Homes (1)
- Outdoor Living (1)
- Parks and Recreation (2)
- PCS and JBSA (2)
- PCS Guide (3)
- PCS Moves (12)
- PCS Moves to Joint Base San Antonio (4)
- PCS Planning (13)
- PCS Randolph AFB (17)
- PCS Relocation (1)
- PCS Resources (6)
- PCS San Antonio (46)
- PCS to San Antonio (42)
- Pearl District Area Real Estate (2)
- PID Assessments (1)
- Pipe Creek (1)
- Places to Eat Near Randolph AFB (1)
- Pool Homes (1)
- Pre Approval (1)
- Pre-Listing Preparation (2)
- Pre-Listing Process (1)
- Prescott Oaks (1)
- Pricing and Marketing Strategy (3)
- Professional Awards and Achievements (2)
- Professional Real Estate Representation (1)
- Property Tax Exemptions Texas (1)
- Property Value Enhancement (1)
- pros and cons living in Converse TX (3)
- Pros and Cons Living in Selma TX (6)
- Pros and Cons of Living in Castroville, TX (4)
- Pros and Cons of Living in San Antonio (33)
- PT500 List (1)
- Purchase Negotiation (1)
- Quality of Life (1)
- Quick Close Real Estate (1)
- Randolph AFB Neighborhoods (2)
- Real Estate (1)
- Real Estate Advice (1)
- Real Estate Agent Recognition (6)
- Real Estate Agent Selection (2)
- Real Estate Agent Value (1)
- Real Estate Consultation (1)
- Real Estate Finance (1)
- Real Estate Financing (1)
- Real Estate Impact (1)
- Real Estate Investment San Antonio (2)
- Real Estate Legal Issues (1)
- Real Estate Market Insights (2)
- Real Estate Market Trends (5)
- Real Estate Professional Designations (1)
- Real Estate Strategy (1)
- Real Estate Technology & Trends (2)
- Real Estate Tips (1)
- Real Estate Tips and Guides (2)
- Real Estate Trends (4)
- RealTrends Verified (1)
- Regional Development (1)
- Regional Real Estate (2)
- Relocating to San Antonio (2)
- Relocation (4)
- Relocation Resources (2)
- Relocation to San Antonio (55)
- Remote Homebuying (1)
- Rental Housing (1)
- Rental Property (1)
- Rental Strategy (1)
- Resale Properties (1)
- Retail Development (2)
- Retire in Boerne TX (11)
- Retire in San Antonio (37)
- Reviews and Recognition (1)
- Rockwall Ranch (1)
- Rural Living (2)
- SABOR (27)
- San Antonio Area Listings (1)
- San Antonio Business Growth (1)
- San Antonio Buyer Resources (2)
- San Antonio Communities (3)
- San Antonio Community Events (1)
- San Antonio Community News (1)
- San Antonio Data Center Development (1)
- San Antonio Development (5)
- San Antonio Development & East Side Real Estate (1)
- San Antonio Dining and Lifestyle (3)
- San Antonio East Side Development (1)
- San Antonio Employment Growth (1)
- San Antonio Food & Community Development (2)
- San Antonio Growth (8)
- San Antonio Home Buying and Selling (2)
- San Antonio Home Buying Guide (5)
- San Antonio Home Improvement (2)
- San antonio home prices (3)
- San Antonio Home Sellers (3)
- San Antonio Homeowner Guide (1)
- San Antonio Homeowner Resources (1)
- San Antonio Homes for Sale (9)
- San Antonio Housing Market (2)
- San Antonio Housing Market & Mortgage Financing (2)
- San Antonio Housing Market Analysis (2)
- San Antonio Housing Trends & Market Analysis (4)
- San Antonio Industrial Development (1)
- San Antonio Industrial Policy (1)
- San Antonio Investment Properties (2)
- San Antonio Job Market (1)
- San Antonio Lifestyle Amenities (1)
- San Antonio Listing (1)
- San Antonio Living (1)
- San Antonio Market (3)
- San Antonio Market Updates (18)
- San Antonio Military Relocation (2)
- San Antonio Neighborhoods (67)
- San Antonio New Construction & Master-Planned Communities (4)
- San Antonio New Home Communities (1)
- San Antonio News (229)
- San Antonio North Side Development (1)
- San Antonio Parks (1)
- San Antonio Property Investment (1)
- San Antonio Property Taxes (2)
- San Antonio Real Estate (144)
- San Antonio Real Estate Agents (5)
- San Antonio Real Estate Excellence (1)
- San Antonio Real Estate Guide (6)
- San Antonio Real Estate Market (41)
- San Antonio Real Estate Market Analysis (6)
- San Antonio Real Estate News (2)
- San Antonio REALTOR Awards (1)
- San Antonio Restaurant News (2)
- San Antonio Restaurant Openings (1)
- San Antonio Seller Resources (2)
- San Antonio Sellers (1)
- San Antonio Spec Homes (1)
- San Antonio Spurs Community Programs (1)
- San Antonio Suburbs (1)
- San Antonio Transportation (2)
- San Antonio University Area Housing (1)
- San Antonio Urban Living (7)
- San Antonio West Side Development (2)
- San Antonio Zoning Policy (1)
- Scenic Loop (1)
- Schertz Home Sellers (1)
- Schertz Real Estate (1)
- Schertz, TX (13)
- School Districts (1)
- School Information (1)
- SCUCISD Schools (1)
- Secured Quick Offer (1)
- Sell Home In San Antonio TX (64)
- Seller (83)
- Seller Education (24)
- Seller Guide (4)
- Seller Guides (1)
- Seller Representation Expertise (1)
- Seller Resources (63)
- Seller Should Understand (1)
- Seller Strategy (3)
- Seller Tips (2)
- Sellers (10)
- Selling A Home in San Antonio (62)
- Selling Your San Antonio Home (3)
- Selma TX (9)
- Single-Story Homes (4)
- Smart Homes (1)
- Solar Homes (2)
- South San Antonio Real Estate (1)
- South Side Economic Growth (1)
- South Side San Antonio (1)
- Southtown (2)
- Southwest San Antonio Real Estate (1)
- Spec Homes and Inventory Homes (1)
- Spurs Arena Project Marvel (1)
- Stone Oak (1)
- Stone Oak Community News (5)
- Suburban Housing Growth (12)
- Suburban Living (2)
- Talise De Culebra (1)
- Technology Growth (3)
- Technology Sector Growth (1)
- Terrell Hills (3)
- Texas Acreage Properties (3)
- Texas Homestead Exemption (1)
- The Dominion Real Estate (1)
- The Rim Area Real Estate (1)
- Things to do in San Antonio TX (21)
- Things to do Near Randolph AFB (4)
- Time Planning (1)
- Time-Sensitive Home Buying (1)
- Timing Strategy (1)
- Tips for Buying New Construction (9)
- Tobin Hill Neighborhoods (2)
- Top Real Estate Agent in San Antonio (3)
- Tourism and Economic Development (1)
- Traders's Joe San Antonio (1)
- Transaction Coordination (1)
- Transportation Infrastructure (1)
- Two-Story Homes (1)
- Universal City (1)
- Updated Homes (1)
- Upscale Communities (1)
- Urban Communities (2)
- Urban Corridor Real Estate (1)
- Urban Development (5)
- Urban Living (3)
- Urban Neighborhoods (4)
- Urban Real Estate (1)
- Urban Renewal Projects (1)
- Urban Revitalization San Antonio (1)
- Utility Cost Reduction (1)
- UTSA Campus Development (1)
- VA Buyers (1)
- VA Home Loan Benefits (3)
- VA Loan Assumptions (3)
- VA loan benefits (27)
- VA Loan Guidance (1)
- VA Loan Home Buying Assistance (2)
- VA Loans (64)
- VA Loans and Military Benefits (3)
- VA Loans and Military Home Buying (3)
- VA Loans San Antonio (43)
- VET Benefits Living in San Antonio (3)
- Veterans Resources (2)
- Village Northwest (1)
- Walkable Communities (1)
- week in sales (38)
- Weekly Sales Report (39)
- West San Antonio (2)
- West San Antonio Development (1)
- West San Antonio Real Estate (3)
- West San Antonio Real Estate Market (2)
- West Side Infrastructure Planning (1)
- West Side Real Estate (1)
- West Side San Antonio (2)
- Windcrest Homes for Sale (1)
Recent Posts