San Antonio Housing Market Update: What Rising Sales Activity and Lower Prices May Mean for Buyers and Sellers
 The latest weekly San Antonio housing data shows an important shift in market behavior that directly affects homeowners making decisions about buying a home in San Antonio or selling a home in San Antonio. While home sales increased meaningfully during the week of April 13 through April 19, 2026, both average and median sales prices moved substantially lower compared to the prior week, creating a specific pattern where volume growth combines with pricing moderation. This particular combination of rising transaction counts with declining price metrics matters significantly for strategic positioning and market interpretation.
For buyers and sellers watching the San Antonio real estate market across neighborhoods throughout San Antonio, Schertz, Cibolo, Helotes, Converse, and Boerne, this type of movement offers valuable insight into current demand dynamics, pricing behavior evolution, and possible opportunities emerging as spring season progresses into mid-April. Tami Price, REALTOR®, notes that when sales volume increases by 6.4% while median prices decline 4.8% simultaneously, this pattern typically reflects inventory composition shift toward entry-level and mid-range properties rather than indicating fundamental demand weakness or market deterioration requiring reactive strategic response. Understanding what drives these inverse relationships between volume and pricing prevents misinterpretation that could compromise buyer and seller outcomes through inappropriate urgency or unwarranted pessimism disconnected from actual market function.
Why This Matters for San Antonio Home Buyers and Sellers
Understanding the relationship between volume increases and pricing decreases provides critical intelligence about inventory composition, market segmentation, and competitive dynamics that monthly summaries completely obscure. When 482 homes close compared to 453 the prior week while median prices drop $15,050 and average prices decline $12,467, these changes reveal specific patterns about which price segments dominated weekly activity rather than indicating uniform market appreciation or depreciation.
For buyers, recognizing that pricing decreases often accompany entry-level concentration creates context for evaluating whether current conditions represent genuine opportunity or simply statistical artifacts from composition effects. The $15,050 median decline and $12,467 average decrease might initially suggest improving affordability and enhanced negotiation leverage across all segments.
For sellers, understanding that volume growth demonstrates sustained buyer demand while pricing moderation reflects composition rather than value deterioration prevents inappropriate pessimism about market conditions. The 482-home week confirms buyers remain active and transactions continue closing successfully despite pricing statistics showing decreases.
The mid-April pattern demonstrates healthy market recalibration where buyer engagement sustains while inventory composition shifts create statistical variations that require professional interpretation to extract meaningful strategic guidance.
What Did the Week of April 6 Through April 12, 2026, Show?
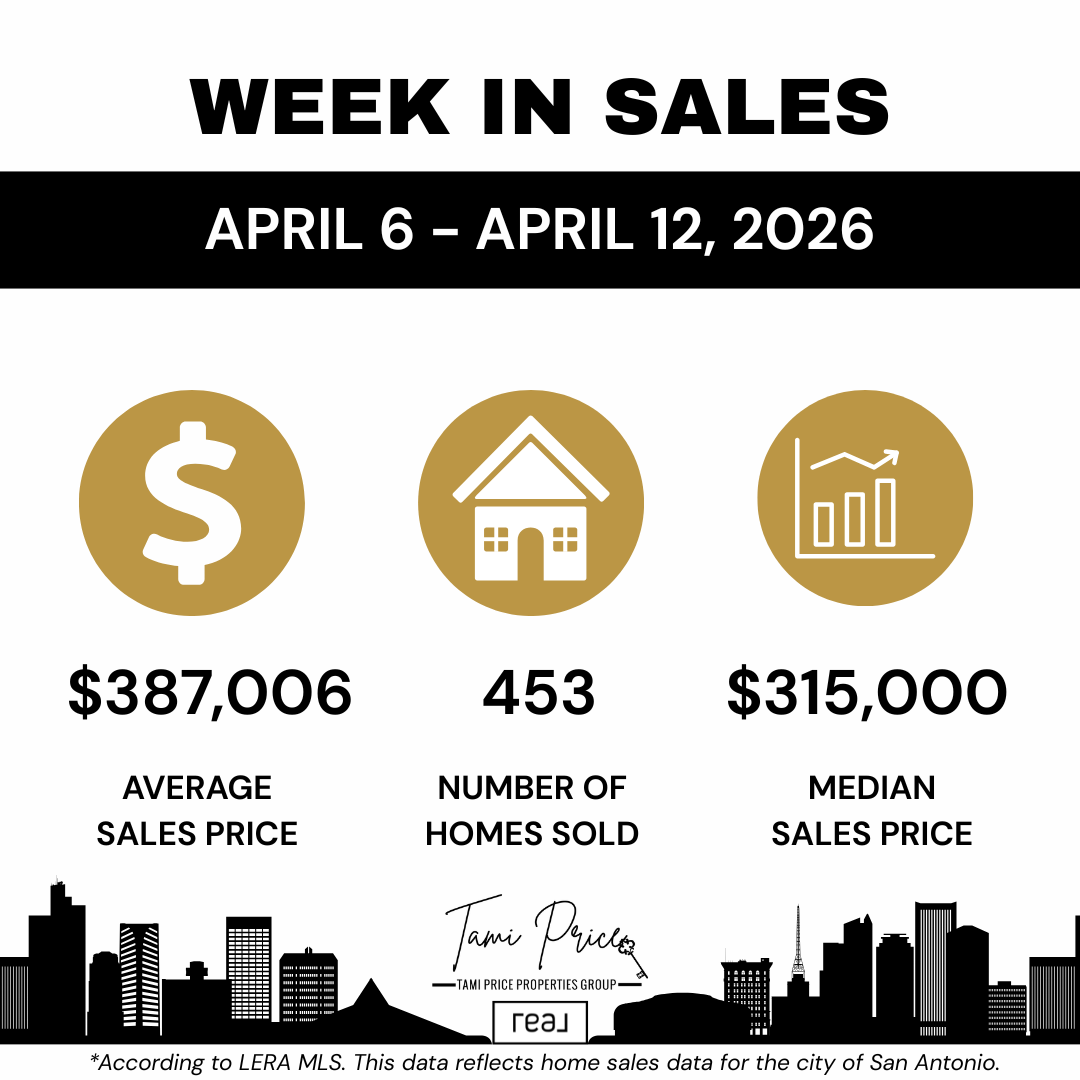
According to LERA MLS® data for the City of San Antonio, the week of April 6 through April 12, 2026, recorded 453 homes sold. The average sales price reached $387,006, while the median sales price came in at $315,000.
This week reflected moderate spring activity with several notable characteristics:
- 453 total closed transactions indicate consistent spring buyer engagement
- Average price of $387,006 positioned near typical spring baseline
- Median price of $315,000 shows center of market activity in mid-range segments
- The $72,006 gap between average and median indicates balanced price tier distribution
- Volume positioned within normal spring range without exceptional acceleration
This early-to-mid April week established baseline context for evaluating subsequent weekly performance and identifying when composition shifts create statistical variations versus when genuine market trends emerge. The 453-home volume represents solid spring market activity maintaining momentum from late March and early April's exceptional 620+ closing weeks.
The median price of $315,000 positioned the center of market activity in mid-range segments where significant portions of San Antonio's housing stock and buyer pools intersect. The average price of $387,006 reflected reasonably balanced distribution across price tiers without extreme luxury concentration pulling the metric substantially higher or heavy entry-level concentration depressing it significantly.
For buyers and sellers making decisions during this period, market conditions represented typical spring development phase where activity sustains at healthy levels without dramatic acceleration or concerning moderation in either direction.
Q: Does 453 weekly closings represent strong or moderate market activity for San Antonio? A: 453 closings represents solid, healthy spring market function. Weekly volume around 400-500 closings indicates balanced conditions with consistent buyer demand without exceptional acceleration. This level shows steady spring momentum following late March's peak 620+ weeks, reflecting normal moderation from exceptional highs while maintaining strong baseline activity.
What Did the Week of April 13 Through April 19, 2026, Reveal?
The following week showed meaningful volume increase with substantial pricing decreases creating inverse relationship that requires professional interpretation. During the week of April 13 through April 19, 2026, San Antonio recorded 482 homes sold with notably different pricing characteristics.
This week's data demonstrates several striking patterns:
- 482 total sales representing a 29-home increase from the prior week
- Average sales price declining to $374,539, a $12,467 decrease from $387,006
- Median sales price dropping to $299,950, a $15,050 decrease from $315,000
- 6.4% volume increase combined with 3.2% average decline and 4.8% median decline
- The $74,589 gap between average and median remaining similar to prior week
Closed sales rose from 453 homes to 482 homes, representing an increase of 29 sales, or approximately 6.4% week over week. An increase in closed transactions often signals continued buyer demand across the market. Despite ongoing affordability concerns and interest rate sensitivity that characterize 2026's housing environment, buyers are still actively entering the San Antonio market and completing purchases successfully.
That volume growth represents an important signal, especially in a market where many buyers have remained selective and payment-conscious throughout winter and spring months. The 482-home total demonstrates robust engagement without reaching the exceptional 600+ levels seen in late March.
Q: Does the $15,050 median price decline signal a market correction beginning? A: No. This most likely reflects composition shift where entry-level and mid-range homes comprised larger share of the 482 closings. When more affordable properties dominate weekly activity, medians naturally decline even when individual property values remain stable. The simultaneous volume increase confirms buyer demand strength rather than indicating fundamental weakness requiring reactive concern.
Understanding What Changed Week Over Week
While sales volume increased meaningfully, pricing metrics moved in the opposite direction across both average and median measures. The average sales price declined from $387,006 to $374,539, representing a decrease of $12,467, or approximately 3.2%. The median sales price dropped from $315,000 to $299,950, showing a decrease of $15,050, or approximately 4.8%.
This inverse relationship between volume and pricing does not necessarily indicate weakening demand, deteriorating market conditions, or concerning directional momentum. Often, short-term price movement reflects shifts in the mix of homes that closed during any given week rather than uniform value changes across all properties and neighborhoods.
Several factors commonly drive these composition-based statistical variations:
- More entry-level homes priced below $280,000 may have closed during the 482-home week
- Fewer higher-priced homes above $450,000 may have reached closing compared to prior week
- Buyers may be gravitating toward homes priced more competitively relative to alternatives
- Sellers may be making pricing adjustments to align with current buyer value expectations
- Builder closings in entry-level segments may have concentrated during this particular week
This is precisely why analyzing both volume and pricing together matters significantly more than examining either metric in isolation. Volume alone could suggest acceleration without context about pricing support. Pricing alone could suggest deterioration without context about demand sustainability.
What Could Rising Sales with Declining Prices Mean for Buyers?
For buyers watching the San Antonio market and evaluating purchase timing and strategy, the mid-April pattern of increased volume with declining pricing creates several distinct considerations worth exploring. The combination suggests potential opportunities emerging while simultaneously confirming sustained competition across key market segments.
There may be genuine opportunities developing in specific situations. Increased sales activity paired with price adjustments can create improved conditions, particularly for buyers who have been waiting for enhanced value positioning or improved negotiation leverage in target neighborhoods.
Some buyers may discover several advantageous dynamics:
- Better negotiating conditions developing in certain price ranges and neighborhoods
- Sellers becoming more responsive to reasonable offers grounded in comparable sales
- More options among homes that have adjusted pricing to meet current market expectations
- Improved opportunities in resale inventory compared to earlier spring weeks
- Enhanced affordability as monthly payment calculations benefit from modest price decreases
For buyers using financing rather than cash purchases, this kind of pricing shift can meaningfully affect affordability calculations and qualification thresholds. Even moderate price adjustments in the $10,000 to $15,000 range can change several critical financial elements:
- Monthly payment projections decreasing by $50 to $100 depending on interest rates
- Cash to close requirements reducing through lower purchase prices
- Loan qualification thresholds becoming more accessible for borderline approvals
- Private mortgage insurance costs potentially decreasing with improved loan-to-value ratios
These financial implications can matter substantially in a rate-sensitive market where buyers carefully evaluate total monthly housing costs including principal, interest, taxes, insurance, and HOA fees.
Q: Should buyers make lower offers across the board based on the $15,050 median decline? A: No. Offer strategy should remain grounded in property-specific comparable sales analysis. If recent comparable sales in your target neighborhood show homes selling at 97-99% of list price, competitive offers remain necessary for well-positioned properties regardless of citywide median changes. Pricing decreases driven by composition effects don't justify blanket offer reductions disconnected from individual property valuations.
Comprehensive guidance on the home buying process in San Antonio from experienced REALTOR® representation helps buyers identify which opportunities reflect genuine value improvements versus which simply represent statistical artifacts from inventory composition shifts.
What Could Rising Sales with Declining Prices Mean for Sellers?
For sellers contemplating listing properties or currently on market seeking offers, the mid-April data presents nuanced signals requiring careful interpretation. Higher sales volume reaching 482 closings represents encouraging confirmation that buyer demand sustains across the market. However, pricing moderation reinforces that strategic positioning remains critical for individual success.
The market clearly shows that homes are selling consistently at healthy volumes. The 482-home week demonstrates robust transaction flow and buyer engagement across diverse neighborhoods, price ranges, and property types. Simultaneously, the market is also demonstrating that buyers remain exceptionally value-conscious, conducting thorough research, comparing alternatives carefully, and making purchase decisions grounded in perceived value rather than emotional urgency.
For sellers, this dual reality reinforces several strategic priorities:
Price Based on Current Comparable Sales
Sellers should avoid relying solely on older comparable sales from stronger pricing periods during late March or early April. Using the most recent and most relevant data from the past 30 to 60 days provides accurate foundation for competitive positioning. Market conditions evolve continuously, and pricing based on outdated comparables creates misalignment with current buyer expectations.
Monitor Competitive Dynamics
Builder incentives, rate buydowns, closing cost assistance, and resale inventory competition continue to influence buyer decisions significantly throughout 2026. New construction alternatives offering 4.99% rate buydowns or $15,000 closing cost credits create competitive pressure on resale sellers to demonstrate clear value advantages through pricing, location, immediate availability, or established neighborhood amenities. Understanding this competitive landscape affects resale positioning strategy.
Position Properties Correctly From Initial Listing
Pricing too aggressively above comparable sales can still create avoidable extended days on market, weakened negotiating leverage, and larger future price adjustments that could have been prevented through accurate initial positioning. The first two weeks on market generate peak showing activity and buyer interest. Overpricing wastes this critical window and creates perception challenges even after price corrections.
Tami Price's comprehensive approach to pricing your San Antonio home incorporates weekly trend monitoring as context while grounding actual pricing recommendations in neighborhood-specific comparable sales analysis ensuring alignment with current buyer value expectations.
Q: Does the 482-home volume week mean sellers can maintain pricing despite median decline? A: Volume alone doesn't create pricing power. The combination of rising volume with declining prices indicates composition shift toward affordable segments where buyer demand concentrates. Sellers in upper-mid-range and luxury segments may see sustained pricing support, but entry-level and mid-range sellers face value-conscious buyers with abundant alternatives. Price based on segment-specific comparable sales, not citywide volume statistics.
Understanding Market Recalibration Versus Market Weakness
A critical analytical distinction exists between markets recalibrating to sustainable levels versus markets experiencing fundamental demand weakness or concerning deterioration. The mid-April San Antonio pattern demonstrates recalibration characteristics rather than weakness indicators.
Sales increased from 453 to 482 homes, confirming buyers remain active and engaged. Buyers continue successfully navigating purchase processes, clearing contingencies, and reaching closing across all neighborhoods. Pricing adjusted downward, but this moderation appears to reflect composition shifts rather than uniform value depreciation requiring alarm.
This combination can reflect a market responding appropriately to affordability constraints, inventory competition from new construction, and evolving buyer behavior rather than exhibiting broad fundamental weakness. Market recalibration represents healthy function where pricing aligns with demand realities. Market weakness shows declining volume with declining prices, increasing days on market, and rising inventory levels creating concerning imbalances.
The distinction matters enormously for strategic decision-making by both buyers and sellers navigating current conditions.
How Does Tami Price, REALTOR®, Guide Clients Through Volume Increases with Price Decreases?
Tami Price, REALTOR®, tracks weekly housing trends across San Antonio to provide clients with clear, data-driven guidance navigating complex patterns like mid-April's rising volume with declining pricing. These week-over-week changes offer valuable insight into how buyer behavior and inventory composition evolve in real time, requiring professional interpretation to extract actionable strategic intelligence.
The combination of increased sales activity with moderating pricing reflects a market that remains active but requires nuanced understanding. Different price points and property types perform differently based on inventory flow, competitive positioning, buyer pool characteristics, and value perceptions. This reality makes customized strategy development more important than ever for both buyers and sellers.
For buyers, guidance emphasizes:
- Recognizing that volume increases confirm market health and sustained demand
- Understanding that pricing decreases often reflect composition rather than uniform value declines
- Identifying which segments and neighborhoods show genuine opportunity versus statistical artifacts
- Maintaining competitive readiness while leveraging improved negotiation positioning where it exists
- Balancing strategic patience with decisive action when appropriate properties appear
For sellers, strategy focuses on:
- Viewing sustained 480+ volume as positive indicator of buyer engagement
- Pricing based on current comparable sales rather than optimistic interpretations resisting market reality
- Understanding that composition-driven median declines don't justify holding overpriced positions
- Preparation and presentation creating differentiation during periods of abundant inventory
- Responsive adjustment when showing feedback indicates pricing misalignment
Whether buying or selling, understanding how volume and pricing interact reveals market dynamics that single-metric analysis completely misses. Mid-April's pattern demonstrates active market with composition-driven pricing variation rather than concerning deterioration or problematic acceleration.
This commitment to accurate data interpretation serves clients across all segments, from first-time home buyers to move-up buyers to military families managing PCS relocations.
Expert Insight from Tami Price
With nearly two decades representing San Antonio buyers and sellers and approximately 1,000 closed transactions across multiple market cycles, Tami Price, REALTOR®, understands that mid-April's rising volume with declining pricing represents healthy market recalibration with composition-driven statistical variation rather than concerning fundamental deterioration requiring reactive strategic response.
"The mid-April pattern tells a story about a market finding sustainable equilibrium after late March's exceptional 630+ peaks," Tami explains. "Sales increased from 453 to 482 homes, confirming buyer demand remains robust and transactions continue closing successfully. The median dropped $15,050 and average declined $12,467, but that most likely reflects heavier entry-level and mid-range concentration during the 482-home week rather than uniform value depreciation across all properties and neighborhoods."
Tami holds multiple designations including Pricing Strategy Advisor (PSA), Seller Representative Specialist (SRS), Accredited Buyer's Representative (ABR), Graduate REALTOR® Institute (GRI), and Military Relocation Professional (MRP). These certifications reflect ongoing education in pricing methodology, market analysis, statistical interpretation, and specialized service for military families.
Her experience analyzing inverse volume-price relationships across multiple market cycles provides perspective preventing reactive interpretations. Some periods show volume and pricing moving together in same direction. Other periods show inverse relationships driven by composition. Neither pattern automatically indicates strength or weakness without proper contextual analysis.
"What matters most for clients is understanding that 482 closings proves this market works effectively week after week," Tami notes. "The pricing statistics simply reflect which homes happened to close during that specific week. For buyers, focus on whether specific target properties represent fair value based on recent comparable sales in those neighborhoods. For sellers, focus on whether your pricing aligns with what similar homes in your area actually sold for recently, not on whether citywide medians rose or fell based on composition effects."
For buyers specifically, Tami's guidance balances opportunity recognition with realistic expectations: "Yes, there may be improved negotiation positioning in certain segments compared to peak spring weeks. But the $15,050 median decline doesn't mean every seller will accept offers 5% below asking price. It means composition shifted. Analyze each property individually based on its specific comparable sales and competitive positioning."
For sellers, Tami emphasizes strategic fundamentals: "The 482-home week creates opportunity for well-positioned properties to capture attention from active buyer pools. But among those 482 closings, properties that sold successfully were those priced at or below market value for their neighborhoods and condition levels. High volume doesn't overcome overpricing. It reinforces the importance of competitive positioning."
This commitment to grounding strategy in comparable sales while using weekly data as context has earned Tami recognition as a RealTrends Verified Top Agent, 15-time Five Star Professional® Award winner, and top real estate agent in San Antonio with more than 650 five-star reviews.
Three Key Takeaways
- Mid-April 2026 showed volume increasing 6.4% to 482 closings while median prices declined 4.8% to $299,950, demonstrating healthy market recalibration with composition-driven statistical variation rather than fundamental demand weakness or concerning deterioration requiring reactive strategic response from buyers or sellers. When sales volume grows while pricing moderates, this inverse relationship typically reflects inventory composition shift toward entry-level and mid-range properties rather than uniform value depreciation across all market segments. The 482-home week confirms buyer demand remains robust and transactions continue closing successfully despite pricing statistics showing decreases. Buyers and sellers should interpret this pattern as market finding sustainable equilibrium following late March's exceptional 630+ peak weeks rather than as signal of deteriorating conditions or emerging crisis requiring urgent action disconnected from property-specific comparable sales analysis and individual circumstances.
- Rising sales with declining prices creates nuanced strategic implications where buyers may discover improved negotiation positioning in specific segments while sellers must maintain accurate comparable sales-based pricing discipline to capture attention from active buyer pools. The combination of volume growth with pricing moderation benefits neither side uniformly across all price ranges and neighborhoods. Entry-level and mid-range buyers may find enhanced opportunities as inventory composition shifts toward their segments, but well-positioned properties in all ranges continue attracting competitive interest. Sellers benefit from sustained 480+ volume confirming buyer engagement exists consistently, but must recognize that composition-driven median declines don't justify maintaining overpriced positions disconnected from recent comparable sales. Both sides succeed through property-specific analysis recognizing which opportunities and challenges apply to their individual circumstances rather than applying blanket interpretations based on citywide statistics aggregating diverse transactions across unrelated segments.
- Understanding the distinction between market recalibration and market weakness prevents misinterpretation that could compromise strategic positioning and transaction outcomes for both buyers and sellers navigating mid-spring conditions. Recalibration shows volume sustaining at healthy levels while pricing adjusts to sustainable baselines following temporary peaks or composition effects. Weakness shows declining volume with declining prices, increasing days on market, and rising inventory creating concerning imbalances. Current mid-April pattern demonstrates recalibration characteristics where pricing aligns with demand realities while transaction flow remains robust. Working with experienced REALTOR® representation that distinguishes these patterns, monitors multi-week trends, provides neighborhood-specific comparable sales analysis, and grounds strategy in current market reality rather than reactive statistical interpretation creates optimal foundation for achieving real estate goals efficiently during periods showing inverse volume-price relationships.
Frequently Asked Questions
Q: What causes sales volume to increase while prices decrease in the same week? A: This inverse relationship typically reflects inventory composition shift where entry-level and mid-range properties comprised larger share of weekly closings. When more affordable homes dominate transaction activity, volume can increase as these segments have larger buyer pools while median and average prices decline due to statistical composition effects. This represents normal market function rather than concerning deterioration.
Q: Does declining median price with rising volume indicate a buyer's market developing? A: Not necessarily uniformly. The combination suggests improved buyer positioning in entry-level and mid-range segments where composition concentrated, but well-positioned properties in all ranges continue attracting competitive interest. Market dynamics vary by price tier, neighborhood, and property-specific characteristics rather than shifting uniformly toward buyer or seller advantage across all segments simultaneously.
Q: Should sellers reduce prices immediately when weekly median statistics decline? A: Only if comparable sales in their specific neighborhood support lower pricing than current list price. Sellers should never adjust based solely on citywide weekly statistics. If a home is priced correctly based on recent neighborhood-specific comparable sales, citywide median changes driven by composition provide no reason for adjustment. If showing activity indicates pricing problems, analyze local comparable sales to determine appropriate strategy.
Q: Can buyers negotiate more aggressively when median prices show weekly declines? A: Negotiation strategy should be based on property-specific positioning relative to comparable sales, not citywide weekly trends. If a property is priced accurately based on recent comparable sales in its neighborhood, aggressive negotiation disconnected from value analysis will likely fail. If a property is overpriced relative to comparables, negotiation opportunities exist regardless of weekly citywide statistics. Analyze each property individually.
Q: How long do composition-driven pricing declines typically last? A: Composition effects change week to week based on which price segments dominate closing activity during specific periods. One week may show median declines from entry-level concentration. Next week may show median increases from luxury concentration. These are statistical artifacts, not sustained trends. Monitor multi-week patterns rather than reacting to single-week variations lacking predictive value for future performance.
Q: Does rising volume mean the spring market momentum is building or fading? A: Volume increasing from 453 to 482 closings indicates sustained spring momentum maintaining healthy baseline activity. This represents solid function rather than exceptional acceleration or concerning moderation. Spring markets typically show variable week-to-week volume based on closing timing, but sustained activity around 400-500 weekly closings confirms healthy demand rather than fading momentum.
Q: Should military PCS buyers wait for further price declines before purchasing? A: Military buyers should focus on achieving housing goals within timeline constraints based on comparable sales analysis rather than attempting to time composition-driven weekly price variations. Waiting for further declines that may not materialize risks missing appropriate properties while incurring temporary housing costs. Work with REALTOR® holding Military Relocation Professional designation for proper data interpretation and timeline management.
Q: How does new construction competition affect resale pricing during composition shifts? A: New construction alternatives with builder incentives create ongoing competitive pressure on resale sellers regardless of weekly composition effects. When resale inventory concentrates in entry-level and mid-range segments where builders compete actively with rate buydowns and closing cost assistance, resale sellers must demonstrate clear value advantages through pricing, location, or immediate availability. Competition remains constant factor independent of weekly statistical variations.
The Bottom Line
The latest San Antonio housing data for mid-April 2026 shows an active market with increasing sales volume reaching 482 closings and moderating prices where median declined $15,050 to $299,950. This combination represents neither simple bullish signal indicating acceleration nor bearish signal suggesting deterioration. Instead, it demonstrates a market providing buyers and sellers with useful information about inventory composition, demand sustainability, and strategic positioning requirements.
For buyers, there may be genuine opportunities developing in specific price ranges and neighborhoods where composition shifts create improved value positioning or enhanced negotiation leverage. Careful analysis identifying where these opportunities exist versus where competitive dynamics remain intense helps buyers make informed decisions grounded in property-specific circumstances rather than reactive responses to citywide statistics.
For sellers, sustained volume around 480 closings confirms buyer demand exists consistently across the market, but pricing moderation reinforces that strategic positioning through accurate comparable sales-based pricing remains essential for capturing attention from active buyer pools. Market data should drive decisions rather than assumptions about what pricing levels the market "should" support disconnected from recent transaction evidence.
In shifting markets showing inverse volume-price relationships, the advantage often goes to those making decisions based on current neighborhood-specific data and property-level analysis, not outdated expectations or generalized interpretations of citywide statistics. Both buyers and sellers benefit from understanding that mid-April's pattern reflects healthy market recalibration finding sustainable equilibrium rather than concerning deterioration requiring reactive strategic responses.
If you are considering buying or selling in San Antonio and want to understand how current market trends specifically affect your options based on comparable sales in your target neighborhoods, working with experienced REALTOR® representation that interprets weekly data properly while grounding strategy in relevant local analysis creates optimal foundation for successful outcomes.
Ready to discuss how mid-April's rising volume with declining pricing specifically affects your buying or selling strategy based on comparable sales analysis in your target neighborhoods? Contact Tami Price, REALTOR®, for guidance grounded in weekly market intelligence combined with neighborhood-specific analysis and nearly two decades of San Antonio market experience.

Contact Tami Price, REALTOR® | San Antonio, TX
Tami Price provides expert buyer and seller representation throughout Greater San Antonio with comprehensive market analysis incorporating weekly trend monitoring, seasonal pattern recognition, and neighborhood-specific comparable sales analysis. Schedule a consultation to discuss your strategy with guidance grounded in current market realities and professional data interpretation.
📞 210-620-6681
Tami Price's Specialties
- Buyer and Seller Representation
- Military Relocations and PCS Moves
- VA Loan Guidance and VA Loan Assumptions
- New Construction Representation
- First Time Home Buyers
- Move Up Buyers
- Downsizing and Rightsizing
- Strategic Pricing and Market Analysis
- San Antonio, Schertz, Cibolo, Helotes, Converse, and Boerne
Disclaimer
This blog is for informational purposes only and does not constitute legal, financial, or real estate advice. Market conditions change, and individual circumstances vary. Readers should consult qualified professionals before making real estate decisions. Tami Price, REALTOR®, is licensed in Texas and affiliated with Real Broker, LLC. Fair Housing principles apply to all content.
Categories
- All Blogs (932)
- Home Buying (14)
- Neighborhood Guides (44)
- 10 Incentive and Rate Buydown Questions (1)
- 10 Military Neighborhood (1)
- 10 Mistakes Sellers Make (1)
- 10 Strategies to Coordinate a Same Day Close (1)
- 12 Lifestyle Questions to Move In (1)
- 12 PCS What Ifs (1)
- 12 Photos and Marketing Assets (1)
- 13 PCS Hunting Trip Tips (1)
- 15 Red Flags Touring Home in San Antonio (1)
- 2026 Market (1)
- 30 days after closing your home (1)
- 7 Offer Terms Beyond Price (1)
- 7 VA Specific Questions (1)
- 78015 Ranked One (1)
- 8 Bridge (1)
- 8 Myths Buyers Believe about Down Payments (1)
- 8 Reasons VA Buyers Love New Construction (1)
- 9 Mistakes Move Up Buyers Make (1)
- 9 Questions to Decide If You Keep Your PCS Home (1)
- 9 Timeline Questions Every Buyer Need to Ask (1)
- 9 Warranty Questions to Ask (1)
- 9 Ways to Attract VA & Military Buyers (1)
- About Tami Price (6)
- Active Adult Homes (1)
- Affordable Communities (2)
- Affordable Housing & Community Development (5)
- Agent Qualifications and Credentials (1)
- Agent Qualifications and Experience (1)
- Agent Recognition (3)
- Agent Selection (1)
- AI and Real Estate Tools (1)
- Alamo Heights (5)
- Alamo Heights ISD (1)
- Alamo Heights Real Estate (1)
- Alamo Ranch (3)
- Amenities in Helotes, Texas (3)
- Apartment Market (1)
- Appraisals (1)
- Arts and Culture (1)
- Awards and Recognition (7)
- Balcones Creek (1)
- Best Neighborhoods to Live in Cibolo, TX (3)
- Best Neighborhoods to Live in San Antonio (16)
- Best Places to Live in Leon Valley: A Neighborhood Guide (1)
- Best Places to Live in Northeast Inner Loop: A Neighborhood Guide (1)
- Bexar County Property Tax (1)
- Bexar County Real Estate (3)
- Boerne Home Sellers (1)
- Boerne Neighborhoods (2)
- Boerne Texas (9)
- Broadway Corridor Development (1)
- Build-to-Rent Communities (1)
- Builder Contracts & Warranties (3)
- Builder Incentives (1)
- Builder Warranties (1)
- Buyer (97)
- Buyer Activity San Antonio (1)
- Buyer and Seller Guidance (4)
- Buyer Due Diligence (1)
- Buyer Education (46)
- Buyer Guide (9)
- Buyer Guides (7)
- Buyer Protection Strategies (1)
- Buyer Representation (1)
- Buyer Representation Expertise (1)
- Buyer Resources (88)
- Buyer Strategy (2)
- Buyers (13)
- Buyers Agent (1)
- Buying a Foreclosed Home in San Antonio (10)
- Buying a Home (3)
- Buying a Home in San Antonio (6)
- Buying Near JBSA (1)
- Buying Timeline (1)
- Buying vs Renting (1)
- Castroville, TX (8)
- Central San Antonio (1)
- Central San Antonio Development (2)
- Central Texas Growth (1)
- Choosing a Real Estate Agent (1)
- Choosing an Agent (1)
- Cibolo Communities (1)
- Cibolo Home Sellers (1)
- Cibolo TX (15)
- Client Reviews and Testimonials (1)
- Client Satisfaction (1)
- Client Stories (1)
- Client Testimonial (4)
- Clients review (4)
- Cobblestone (1)
- Comal County (1)
- Commercial & Retail Development (27)
- Commercial Development (13)
- Commercial Development Impact on Home Values (1)
- Commercial Real Estate (1)
- Community (1)
- Community Amenities (2)
- Community Development (23)
- Community Development and Real Estate (3)
- Community Events & Development (1)
- Community Infrastructure (1)
- Community Investment Impact (2)
- Community Landmarks (1)
- Community News (4)
- Community Planning (2)
- Community Revitalization (1)
- Community Spotlights (1)
- Commuter Neighborhoods (1)
- Cons of Living in Helotes, TX (4)
- Conservation Communities (1)
- Contingency Questions (1)
- Converse Home Sellers (1)
- Converse Homes For Sale (3)
- Converse Real Estate (1)
- Converse TX (10)
- Converse TX Real Estate (1)
- Cost of Living Guides (1)
- Cost of Living in San Antonio TX (25)
- CPS Energy Programs (1)
- Custom Homes (5)
- Davis Ranch (1)
- Days on Market (1)
- Deco District San Antonio (1)
- Denver Heights (1)
- Down Payment Assistance (1)
- Downtown Boerne (1)
- Downtown Development (3)
- Downtown Living (1)
- Downtown Revitalization (14)
- Downtown San Antonio (2)
- Downtown San Antonio Real Estate (5)
- Downtown San Antonio Revitalization (1)
- Dual Military (1)
- East Side Living (1)
- East Side Neighborhoods (1)
- East Side San Antonio (4)
- Economic Development (3)
- Economic Growth & Industry (1)
- Education, Texas Hill Country (1)
- Emerald Pointe (1)
- Employment (1)
- Employment Corridors (1)
- Encino Forest (1)
- Entertainment Economy (1)
- Equity and Pricing Strategy (2)
- Equity Q&A (1)
- Established Communities (3)
- Events in San Antonio (207)
- Expert Advice from Tami Price, Realtor® (10)
- Fair Oak Ranch (1)
- Family Activities (2)
- Family Homes (3)
- Family Living in San Antonio (1)
- FAQ (1)
- Far Northwest San Antonio (1)
- Far West San Antonio (1)
- Far Westside Real Estate (4)
- Fastest Growing Zip Codes in America (1)
- Featured Homes for Sale (2)
- Featured Properties (1)
- Financial Planning (10)
- Financing Strategy (1)
- First Time Buyers (23)
- First Time Sellers (1)
- First-Time Buyers (6)
- First-Time Homebuyer Resources (4)
- First-Time Homebuyer Tips (2)
- First-Time Homebuyers (6)
- First-Time Investors (1)
- Fort Sam Houston (3)
- Fort Sam Houston Real Estate (1)
- Fort Sam Houston, TX (2)
- Fox Grove (1)
- FSBO vs Agent Representation (1)
- Future Rental (1)
- Gated Communities (5)
- Golf Communities (1)
- Great Northwest (1)
- Greater San Antonio Housing Trends (2)
- Greater San Antonio Real Estate (5)
- Green Home Upgrades (1)
- Growth and Development (11)
- Healthcare (1)
- HELOC (1)
- Helotes Home Sellers (1)
- Highway 151 Corridor Growth (1)
- Hill Country Business (1)
- Hill Country Communities (2)
- Hill Country Development (3)
- Hill Country Homes for Sale (1)
- Hill Country Living (3)
- Hill Country Market Updates (1)
- Hill Country Real Estate (4)
- Hill Country Retreat (1)
- Historic Districts (5)
- Historic Neighborhoods (4)
- Historic Preservation (2)
- Holiday Attractions (1)
- Holiday Guide (1)
- Home Buying (7)
- Home Buying Education (3)
- Home Buying Guide (7)
- Home Buying Process (8)
- Home Buying Strategy (2)
- Home Buying Tips (6)
- Home Energy Efficiency San Antonio (4)
- Home Financing (2)
- Home Improvement ROI (1)
- Home Inspections (1)
- Home Preparation (2)
- Home Pricing Strategy (14)
- Home Renovation for Resale (1)
- Home Selling (10)
- Home Selling Guide (11)
- Home Selling Strategies (3)
- Home Selling Strategy (3)
- Home Selling Tips (22)
- Home Staging and Updates (2)
- Home Values (2)
- Homebuyer Education (15)
- Homebuyer Resources (1)
- Homebuying Guide (1)
- Homebuying Tips (3)
- Homeowner (36)
- Homeowner Tax Benefits (1)
- Homeownership Costs (1)
- Homes for Sale (2)
- Homes for sale near Lackland AFB (4)
- Homes Near Military Bases (1)
- Homestead amenities (1)
- Horizon Pointe (1)
- House Hunting Guide (1)
- Housing (1)
- Housing Community Development (1)
- Housing Development (2)
- Housing Market Updates (3)
- How to Buy a House in San Antonio TX (48)
- Huebner Oaks shopping center (1)
- Hunters Ranch (1)
- Hybrid (1)
- I-10 Corridor (1)
- I-35 Corridor (1)
- In Person (1)
- Incorporated Cities (6)
- Industrial Investment Impact (1)
- Industry News (2)
- Industry Recognition (1)
- Infrastructure & Growth Projects (26)
- Infrastructure and Sustainability (1)
- Infrastructure Development (1)
- Infrastructure Investment (1)
- Infrastructure Updates (2)
- Interest Rates (2)
- Invest in San Antonio (46)
- Investment Opportunities (3)
- Investment Property San Antonio (4)
- JBSA (9)
- JBSA Housing (11)
- JBSA Real Estate (4)
- JBSA Resources (7)
- Joint Base San Antonio (5)
- Joint Base San Antonio Housing (1)
- Judson ISD (2)
- Kendall County (1)
- La Cantera Retail Development (1)
- Lackland AFB (7)
- Lackland AFB Housing (1)
- Land Conservation (1)
- Land Use Planning (1)
- Lera MLS (15)
- Lifestyle & Community Growth (18)
- Lifestyle & Local Growth (12)
- Lifestyle Amenities (1)
- Lifestyle Communities (1)
- Listing Preparation (1)
- Listing Strategy (1)
- Live Oak (1)
- Living in San Antonio, TX (52)
- Living Near Randolph AFB (7)
- Loan Programs (1)
- Local Attractions (3)
- Local Business (1)
- Local Business & Development (9)
- Local Business & Economy (3)
- Local Business Spotlight (20)
- Local Business Support (5)
- Local Development (4)
- Local Development News (9)
- Local Market Insights (5)
- Local News (2)
- Local News Around San Antonio (2)
- Local Policy Changes (1)
- Local Real Estate News (1)
- Loop 1604 Corridor Growth (2)
- Loop 410 Corridor Development (1)
- Luxury Communities (3)
- Luxury Homes (2)
- Luxury Real Estate (1)
- Luxury Retail San Antonio (1)
- MacArthur Park (1)
- Major Developments (2)
- Making Offers on Homes (1)
- Market Analysis (26)
- Market Conditions (47)
- Market Expertise (1)
- Market Insights (5)
- Market Strategy (1)
- Market Timing (2)
- Market Trends (10)
- Market Trends & Insights (2)
- Market Update (17)
- Market Update 2026 (1)
- Market Updates (22)
- Master Planned Communities (12)
- Medical Center Area Real Estate (1)
- Medina Valley ISD (2)
- Midtown Living (1)
- Military & Economic Impact (3)
- Military Buyers (3)
- Military Communities (1)
- Military Families (1)
- Military Family Resources (1)
- Military Heritage (1)
- Military Homebuying (3)
- Military Homeownership (1)
- Military Housing (3)
- Military Housing Market in Texas (16)
- Military Life in San Antonio (2)
- Military Neighborhoods (1)
- Military PCS Relocations (3)
- Military Real Estate (2)
- Military Relocation (97)
- Military Relocation & VA Loans (10)
- Military Relocation San Antonio (4)
- Military Relocation Services (3)
- Military Relocation to San Antonio (50)
- Military Relocations (19)
- Military Relocations & VA Home Loans (5)
- Mixed-Income Housing (1)
- MLS Accuracy & Data Transparency (1)
- Mortgage Programs (1)
- Mothers Day in San Antonio (1)
- Move to Boerne TX (18)
- Move to Castroville TX (11)
- Move to Converse TX (16)
- Move to New Braunfels (1)
- Move to North San Antonio (19)
- Move to San Antonio TX (73)
- Move to Selma TX (19)
- Move to Shertz TX (13)
- Move to Texas (53)
- Move Up Buyer Resources (1)
- Move Up Buyers (21)
- Move-In Ready Homes (3)
- Move-In Ready Homes San Antonio (2)
- Move-Up Buyers (2)
- Moving to Helotes, TX (17)
- Moving to San Antonio (69)
- MUD Taxes (1)
- Natalia Homes For Sale (1)
- Near East Side Living (1)
- Negotiation Strategy (2)
- Neighborhood Amenities (1)
- Neighborhood Development (1)
- Neighborhood Guides (7)
- Neighborhood Investment (1)
- Neighborhood News (2)
- Neighborhood Revitalization (2)
- Neighborhood Spotlights (12)
- Neighborhood Updates (1)
- Neighborhoods near Randolph AFB (12)
- New Braunfels (6)
- New Braunfels Homes For Sale (1)
- New Braunfels News (3)
- New Braunfels Real Estate (3)
- New Businesses (2)
- New Construction (59)
- New Construction Communities (1)
- New Construction Homes (13)
- New Construction Homes San Antonio (5)
- New Construction vs Resale (1)
- New Construction Without Customization (1)
- New Construction Without the Wait (1)
- New Contruction Cost (1)
- New Development (3)
- New Listing (19)
- New Restaurants (3)
- News (211)
- News & updates (213)
- No HOA Homes (1)
- North Central San Antonio (5)
- North East ISD (4)
- North San Antonio (9)
- North San Antonio Real Estate (3)
- North Side Neighborhoods (1)
- North Side San Antonio Development (2)
- Northeast Inner Loop (1)
- Northeast Inner Loop Neighborhoods (1)
- Northeast San Antonio (3)
- Northside ISD (5)
- Northwest San Antonio (9)
- Northwest San Antonio Development (1)
- Northwest San Antonio Growth (1)
- Northwest San Antonio Real Estate (3)
- Northwood (1)
- Olympia Hills (1)
- One-Story Homes (1)
- Outdoor Living (1)
- Parks and Recreation (2)
- PCS and JBSA (2)
- PCS Guide (3)
- PCS Moves (12)
- PCS Moves to Joint Base San Antonio (4)
- PCS Planning (15)
- PCS Randolph AFB (17)
- PCS Relocation (1)
- PCS Resources (6)
- PCS San Antonio (46)
- PCS to San Antonio (42)
- Pearl District Area Real Estate (2)
- PID Assessments (1)
- Pinon Creek (1)
- Pipe Creek (1)
- Places to Eat Near Randolph AFB (1)
- Pool Homes (1)
- Pre Approval (1)
- Pre-Listing Preparation (2)
- Pre-Listing Process (1)
- Prescott Oaks (1)
- Pricing and Marketing Strategy (3)
- Professional Awards and Achievements (2)
- Professional Real Estate Representation (1)
- Property Tax Exemptions Texas (1)
- Property Value Enhancement (1)
- pros and cons living in Converse TX (3)
- Pros and Cons Living in Selma TX (6)
- Pros and Cons of Living in Castroville, TX (4)
- Pros and Cons of Living in San Antonio (33)
- PT500 List (1)
- Purchase Negotiation (1)
- Quality of Life (1)
- Quick Close Real Estate (1)
- Randolph AFB Neighborhoods (2)
- Real Estate (1)
- Real Estate Advice (1)
- Real Estate Agent Recognition (6)
- Real Estate Agent Selection (2)
- Real Estate Agent Value (1)
- Real Estate Consultation (1)
- Real Estate Finance (1)
- Real Estate Financing (1)
- Real Estate Impact (1)
- Real Estate Investment San Antonio (2)
- Real Estate Legal Issues (1)
- Real Estate Market Insights (2)
- Real Estate Market Trends (5)
- Real Estate Professional Designations (1)
- Real Estate Strategy (1)
- Real Estate Technology & Trends (2)
- Real Estate Tips (1)
- Real Estate Tips and Guides (2)
- Real Estate Trends (4)
- RealTrends Verified (1)
- Regional Development (1)
- Regional Real Estate (2)
- Relocating to San Antonio (2)
- Relocation (4)
- Relocation Resources (2)
- Relocation to San Antonio (55)
- Remote Homebuying (1)
- Rental Housing (1)
- Rental Property (1)
- Rental Strategy (1)
- Resale Properties (1)
- Retail Development (2)
- Retire in Boerne TX (11)
- Retire in San Antonio (37)
- Retirement Communities (1)
- Reviews and Recognition (1)
- Rockwall Ranch (1)
- Rural Living (2)
- SABOR (28)
- San Antonio Area Listings (1)
- San Antonio Business Growth (1)
- San Antonio Buyer Resources (2)
- San Antonio Communities (3)
- San Antonio Community Events (1)
- San Antonio Community News (1)
- San Antonio Data Center Development (1)
- San Antonio Development (5)
- San Antonio Development & East Side Real Estate (1)
- San Antonio Dining and Lifestyle (3)
- San Antonio East Side Development (1)
- San Antonio Employment Growth (1)
- San Antonio Food & Community Development (2)
- San Antonio Growth (8)
- San Antonio Home Buying and Selling (2)
- San Antonio Home Buying Guide (5)
- San Antonio Home Improvement (2)
- San antonio home prices (3)
- San Antonio Home Sellers (3)
- San Antonio Homeowner Guide (1)
- San Antonio Homeowner Resources (1)
- San Antonio Homes for Sale (12)
- San Antonio Housing Market (2)
- San Antonio Housing Market & Mortgage Financing (2)
- San Antonio Housing Market Analysis (2)
- San Antonio Housing Trends & Market Analysis (4)
- San Antonio Industrial Development (1)
- San Antonio Industrial Policy (1)
- San Antonio Investment Properties (2)
- San Antonio Job Market (1)
- San Antonio Lifestyle Amenities (1)
- San Antonio Listing (1)
- San Antonio Living (1)
- San Antonio Market (3)
- San Antonio Market Updates (18)
- San Antonio Military Relocation (2)
- San Antonio Neighborhoods (67)
- San Antonio New Construction & Master-Planned Communities (4)
- San Antonio New Home Communities (1)
- San Antonio News (229)
- San Antonio North Side Development (1)
- San Antonio Parks (1)
- San Antonio Property Investment (1)
- San Antonio Property Taxes (2)
- San Antonio Real Estate (155)
- San Antonio Real Estate Agents (6)
- San Antonio Real Estate Excellence (1)
- San Antonio Real Estate Guide (6)
- San Antonio Real Estate Market (41)
- San Antonio Real Estate Market Analysis (6)
- San Antonio Real Estate News (2)
- San Antonio REALTOR Awards (1)
- San Antonio Restaurant News (2)
- San Antonio Restaurant Openings (1)
- San Antonio Seller Resources (2)
- San Antonio Sellers (1)
- San Antonio Spec Homes (1)
- San Antonio Spurs Community Programs (1)
- San Antonio Suburbs (1)
- San Antonio Transportation (2)
- San Antonio University Area Housing (1)
- San Antonio Urban Living (7)
- San Antonio West Side Development (2)
- San Antonio Zoning Policy (1)
- Scenic Loop (1)
- Schertz Home Sellers (1)
- Schertz Real Estate (1)
- Schertz, TX (13)
- School Districts (1)
- School Information (1)
- SCUCISD Schools (1)
- Secured Quick Offer (1)
- Sell Home In San Antonio TX (64)
- Seller (83)
- Seller Education (24)
- Seller Guide (4)
- Seller Guides (1)
- Seller Representation Expertise (1)
- Seller Resources (67)
- Seller Should Understand (1)
- Seller Strategy (3)
- Seller Tips (2)
- Sellers (10)
- Selling A Home in San Antonio (62)
- Selling Your San Antonio Home (3)
- Selma TX (9)
- Single-Story Homes (4)
- Smart Homes (1)
- Solar Homes (2)
- South San Antonio Real Estate (1)
- South Side Economic Growth (1)
- South Side San Antonio (1)
- Southtown (2)
- Southwest San Antonio Real Estate (1)
- Spec Homes and Inventory Homes (2)
- Spurs Arena Project Marvel (1)
- Stone Oak (2)
- Stone Oak Community News (5)
- Suburban Housing Growth (12)
- Suburban Living (2)
- Talise De Culebra (1)
- Technology Growth (3)
- Technology Sector Growth (1)
- Terrell Hills (3)
- Texas Acreage Properties (3)
- Texas Homestead Exemption (1)
- The Dominion Real Estate (1)
- The Rim Area Real Estate (1)
- Things to do in San Antonio TX (21)
- Things to do Near Randolph AFB (4)
- Time Planning (1)
- Time-Sensitive Home Buying (1)
- Timing Strategy (1)
- Tips for Buying New Construction (9)
- Tobin Hill Neighborhoods (2)
- Top Real Estate Agent in San Antonio (3)
- Tourism and Economic Development (1)
- Traders's Joe San Antonio (1)
- Transaction Coordination (1)
- Transportation Infrastructure (1)
- Two-Story Homes (2)
- Universal City (1)
- Updated Homes (2)
- Upscale Communities (1)
- Urban Communities (2)
- Urban Corridor Real Estate (1)
- Urban Development (5)
- Urban Living (3)
- Urban Neighborhoods (4)
- Urban Real Estate (1)
- Urban Renewal Projects (1)
- Urban Revitalization San Antonio (1)
- Utility Cost Reduction (1)
- UTSA Campus Development (1)
- VA Buyers (1)
- VA Home Loan Benefits (3)
- VA Loan Assumptions (3)
- VA loan benefits (27)
- VA Loan Guidance (1)
- VA Loan Home Buying Assistance (2)
- VA Loans (70)
- VA Loans and Military Benefits (3)
- VA Loans and Military Home Buying (3)
- VA Loans San Antonio (43)
- VET Benefits Living in San Antonio (3)
- Veterans Resources (3)
- Village Northwest (1)
- Virtual Buyers (1)
- Walkable Communities (1)
- week in sales (40)
- Weekly Sales Report (41)
- West San Antonio (2)
- West San Antonio Development (1)
- West San Antonio Real Estate (3)
- West San Antonio Real Estate Market (2)
- West Side Infrastructure Planning (1)
- West Side Real Estate (1)
- West Side San Antonio (2)
- Windcrest Homes for Sale (1)
Recent Posts