San Antonio Housing Market Update: December 2025 to January 2026 Trends
What Do Late 2025 and Early 2026 Sales Trends Reveal About San Antonio Housing?
Weekly sales data spanning the holiday transition provides insight into market dynamics that both buyers and sellers can factor into housing decisions. The San Antonio housing market moved through December 2025 with consistent activity and transitioned into January 2026 with renewed buyer engagement. For those evaluating homes for sale in San Antonio or considering selling a home in San Antonio, understanding what recent trends signal about current conditions helps inform timing and strategy.
According to Tami Price, REALTOR®, weekly data snapshots provide real-time market intelligence that helps both buyers and sellers calibrate expectations more accurately than monthly or quarterly reports allow.
LERA MLS data across the holiday transition shows how transaction volume and pricing shifted as the year changed. These patterns offer context for understanding current market behavior and developing appropriate strategies for both purchasing and selling.
Key observations from holiday transition data:
- Transaction volume remaining consistent across holiday period
- Pricing patterns reflecting seasonal sales mix changes
- Buyer engagement continuing through year-end transition
- Market functionality demonstrated through steady activity
- Opportunities emerging for both buyers and sellers
Q: Why does weekly data provide better insight than monthly reports?
A: Weekly data reveals short-term patterns and momentum shifts that monthly statistics average out. Understanding how markets behave during specific periods helps buyers and sellers calibrate expectations more precisely. The difference between mid-December activity and early January patterns becomes visible in weekly data but disappears in monthly aggregation.
What Did Weekly Sales Data Show for the Holiday Transition Period?
Examining consecutive weeks across the holiday transition provides snapshot of how market activity maintained momentum. Both buyers and sellers benefit from understanding these patterns when evaluating current conditions and developing strategy.
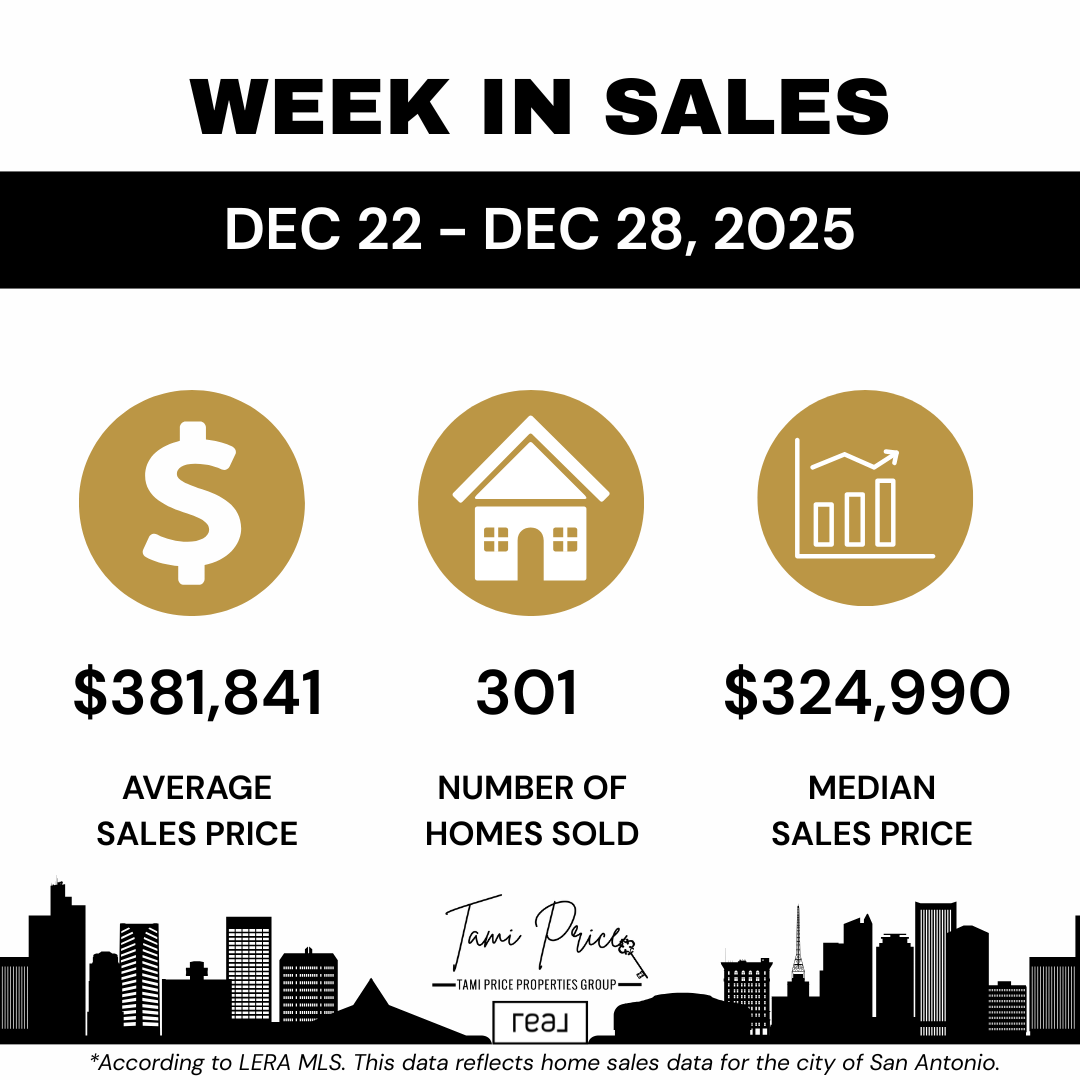
December 15-21, 2025: San Antonio recorded 472 homes sold with average sales price of $416,980 and median sales price of $350,000. This pre-holiday week showed strong activity with buyers actively closing before Christmas.
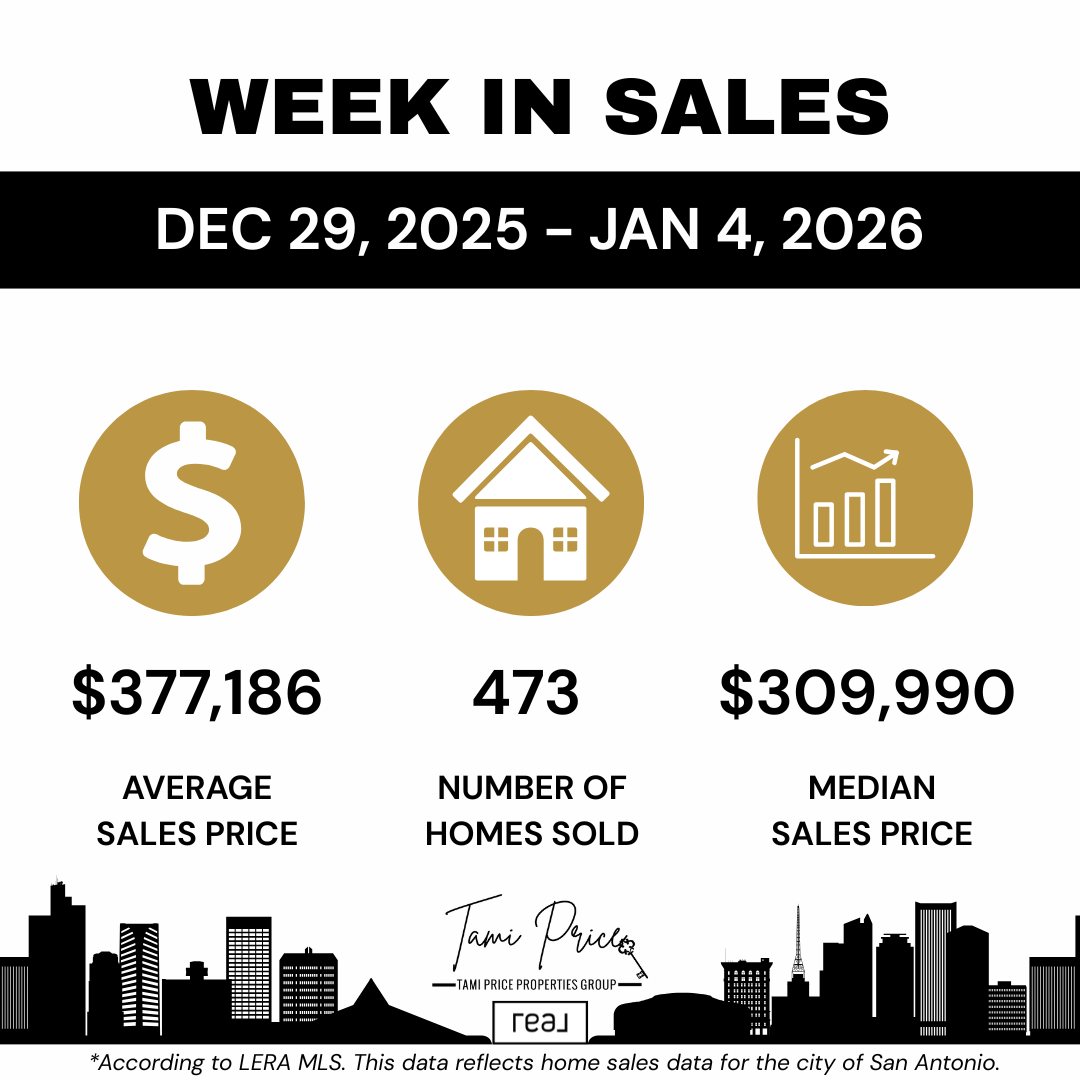
December 29, 2025 - January 4, 2026: Activity returned quickly after holidays with 473 homes sold, nearly matching pre-holiday volume. Average sales price adjusted to $377,186 while median sales price came in at $309,990.
The volume consistency across these periods demonstrates that buyer engagement continued through the holiday transition. The pricing shift reflects changing sales mix rather than market deterioration, with early January typically seeing higher proportion of moderately priced transactions.
Weekly data comparison:
- Pre-holiday: 472 sales, $416,980 average, $350,000 median
- Post-holiday: 473 sales, $377,186 average, $309,990 median
- Volume nearly identical across transition
- Pricing reflecting seasonal mix changes
- Buyer engagement maintained through holidays
Q: What explains the price differences between these periods?
A: The drop in both average and median prices between mid-December and early January typically reflects sales mix rather than value decline. Early January often sees higher proportion of first-time buyer transactions and moderately priced homes, shifting overall averages downward. This seasonal pattern recurs annually and does not indicate market weakness.
How Should Buyers Interpret Holiday Transition Market Data?
Understanding what these patterns mean for purchase strategy helps buyers develop effective approaches. The data reveals opportunities and considerations worth evaluating.
The consistent transaction volume across holiday weeks demonstrates that buyers remained engaged and successful throughout the period. More than 400 homes selling weekly indicates active market with choices across neighborhoods, styles, and price ranges. Buyers have options when inventory supports this level of transaction activity.
The pricing patterns suggest early January may offer opportunities for buyers in moderate price ranges. When sales mix shifts toward more affordable segments, buyers in those ranges find more comparable activity and potentially more motivated sellers who listed during holiday periods.
Buyer considerations from transition data:
- Consistent volume indicating active, functional market
- Choices available across price ranges and neighborhoods
- Early January patterns potentially favoring moderate budgets
- Holiday-period sellers potentially offering flexibility
- Strategic timing opportunity from seasonal patterns
Q: Does early January offer advantages for buyers?
A: Early January can offer advantages including reduced competition from buyers who pause during holidays, potential seller motivation from holiday-period listings, and seasonal price patterns that may favor moderate price ranges. However, inventory selection may be smaller than spring periods. Evaluate whether these advantages align with your search criteria and timeline.
How Should Sellers Interpret Holiday Transition Market Data?
Understanding what these patterns mean for selling strategy helps homeowners evaluate timing and positioning. The data confirms important realities for sellers considering market entry.
The volume consistency demonstrates that well-positioned properties found buyers throughout the holiday transition. Homes that met market expectations continued selling regardless of calendar timing. This confirms that preparation and positioning matter more than seasonal timing alone.
However, the pricing patterns warrant attention for sellers evaluating strategy. Early January sales mix shifting toward moderate price ranges means sellers in higher price segments may face different dynamics than those in more active segments. Understanding where your property fits within current activity helps calibrate expectations.
Seller considerations from transition data:
- Properties selling consistently when positioned appropriately
- Preparation mattering more than seasonal timing
- Price segment affecting relevant market dynamics
- Early January patterns worth monitoring for strategy
- Buyer engagement confirming market demand
Q: Should sellers adjust expectations for early 2026?
A: Sellers should monitor how their specific price segment performs rather than reacting to overall market averages. If your property falls within ranges showing strong activity, market conditions support confident positioning. If your segment shows different patterns, strategy adjustment may be warranted. Professional market analysis helps identify which dynamics affect your specific situation.
What Does Consistent Transaction Volume Indicate About Market Health?
Understanding what steady activity signals helps both buyers and sellers evaluate broader market conditions. The holiday transition data provides insight worth considering.
More than 400 weekly transactions through both holiday and post-holiday periods indicates functioning market with genuine buyer demand. This consistency suggests that underlying market fundamentals support current activity levels. Neither holiday slowdowns nor new year transitions significantly disrupted transaction flow.
For buyers, consistent volume provides confidence that the market offers genuine opportunity. Properties are trading, negotiations are succeeding, and transactions are closing. For sellers, it confirms that buyer demand exists for appropriately positioned properties across calendar periods.
Volume consistency indicators:
- Market functioning through seasonal transitions
- Buyer demand supporting current activity
- Transaction flow uninterrupted by holidays
- Fundamental strength demonstrated through consistency
- Confidence foundation for both audiences
Q: How does San Antonio volume compare to historical patterns?
A: Weekly sales volumes in the 400-500 range during holiday periods align with typical San Antonio patterns for late December and early January. This consistency with historical norms suggests market stability rather than unusual conditions. Both buyers and sellers can interpret current activity as representative of normal market function.
How Do Median and Average Price Differences Inform Housing Decisions?
Understanding what these metrics reveal helps both buyers and sellers interpret market data accurately. The distinction matters for calibrating expectations.
Median price represents the middle transaction, where half of sales occurred above and half below. This metric indicates where most market activity concentrates and provides more stable indication of typical transactions than averages susceptible to outlier influence.
Average price reflects total sales value divided by transaction count, making it sensitive to luxury or distressed sales that can skew results. When average drops more significantly than median, it often indicates fewer high-end transactions rather than broad market decline.
Metric interpretation guidance:
- Median indicating typical transaction level
- Average susceptible to sales mix influence
- Divergence revealing segment-specific patterns
- Both metrics providing useful but different insight
- Combining metrics for fuller market picture
Q: Which metric should buyers and sellers prioritize?
A: Median provides better indication of where most transactions occur, making it more relevant for typical buyers and sellers. Average can indicate market breadth and luxury segment activity. Use median for calibrating expectations about typical transactions, but monitor both for complete market understanding.
What Seasonal Patterns Should Buyers Anticipate?
Understanding how seasonal cycles affect markets helps buyers develop strategy aligned with predictable patterns. Historical and current data inform expectations.
Early January typically sees increased activity as buyers who paused during holidays re-engage with the market. This renewed activity often accelerates through January and February before spring brings peak competition. Buyers active during early winter may find less competition than spring markets typically generate.
The pricing patterns showing lower medians in early January often reflect first-time buyer and moderate price range activity increasing. Buyers in these segments may find more comparable activity and seller attention during this period.
Seasonal buyer considerations:
- January activity increasing as holidays conclude
- Competition lower than spring peak periods
- Moderate price ranges showing increased activity
- Strategic timing opportunity before spring
- Window for negotiating leverage
Q: When does spring competition typically intensify?
A: San Antonio markets typically see increased buyer activity and competition building through February and March, with peak competition often occurring in April through June. Buyers seeking to avoid peak competition should consider accelerating searches during January and February when inventory begins increasing but competition remains lower than spring levels.
What Seasonal Patterns Should Sellers Anticipate?
Understanding how seasonal cycles affect markets helps sellers develop timing and positioning strategies. Historical and current data inform expectations for listing decisions.
Early January activity sets foundation for spring market building. Sellers listing early in the year may capture buyer attention before inventory increases create more competition. Properties entering markets before spring listings accumulate may receive more focused buyer attention.
However, spring markets typically bring both increased buyer activity and increased inventory. Sellers must evaluate whether early market entry advantages outweigh waiting for peak buyer activity. Property characteristics and personal circumstances affect which approach optimizes outcomes.
Seasonal seller considerations:
- Early listings capturing attention before inventory increases
- Spring bringing both more buyers and more competition
- Property characteristics affecting optimal timing
- Personal circumstances influencing strategy
- Market entry timing as strategic decision
Q: Should sellers list early or wait for spring?
A: Optimal timing depends on property characteristics, personal circumstances, and market segment dynamics. Well-prepared properties can succeed during any period. Those competing effectively against limited inventory may benefit from early listing. Those requiring maximum buyer activity may benefit from spring timing. Professional guidance helps evaluate tradeoffs for specific situations.
How Can Buyers Use Weekly Data for Offer Strategy?
Understanding how current data informs offer approach helps buyers compete effectively. Weekly trends provide context for developing realistic strategies.
When weekly sales consistently exceed 400 transactions, buyers should recognize active competition for well-priced properties. The data suggests that properties meeting market expectations continue selling, meaning buyers must be prepared to act decisively when finding homes matching their criteria.
The pricing data helps buyers calibrate offer levels. Understanding where medians fall and how averages compare helps develop offers aligned with current market rather than outdated assumptions. Properties priced appropriately for current conditions will attract competitive interest.
Offer strategy from data:
- Active market requiring prepared buyers
- Well-priced properties generating interest
- Offer levels calibrated to current data
- Decisiveness valuable in consistent markets
- Realistic expectations from trend understanding
Q: How should buyers calibrate offers to current data?
A: Review recent comparable sales in target neighborhoods rather than relying on citywide averages. Understand how specific properties compare to recent transactions in their immediate areas. Develop offers reflecting actual market activity for comparable properties rather than applying broad market statistics to individual transactions.
How Can Sellers Use Weekly Data for Pricing Strategy?
Understanding how current data informs pricing helps sellers position competitively. Weekly trends provide context for developing realistic expectations.
The consistent transaction volume confirms that appropriately priced properties find buyers. Sellers should interpret this as validation that market demand exists when pricing aligns with buyer expectations. Properties priced above market face extended marketing periods while those aligned with data continue trading.
The pricing patterns showing early January medians around $310,000 help sellers in moderate price ranges understand their competitive environment. Those in higher segments should analyze comparable activity in their specific ranges rather than applying overall market statistics.
Pricing strategy from data:
- Appropriate pricing generating buyer interest
- Market demand validated by consistent volume
- Segment-specific analysis more valuable than averages
- Competitive positioning essential for success
- Data informing realistic expectations
Q: How should sellers evaluate pricing against current data?
A: Focus on recent sales of comparable properties in your specific neighborhood and price range rather than applying citywide medians. Understand how your home compares to recent transactions with similar characteristics. Develop pricing reflecting actual comparable activity rather than aspirational positioning that may extend marketing time.
What Questions Should Buyers Ask When Evaluating Current Conditions?
Buyers benefit from asking specific questions revealing how current data affects their purchase approach. Systematic evaluation helps develop effective strategy.
Assess how your target price range compares to current activity. The early January median around $310,000 indicates strong moderate price range activity. Buyers targeting different segments should understand how their ranges perform relative to overall market patterns.
Consider your timeline and how it affects strategy options. Buyers with flexibility can time activity strategically across seasonal patterns. Those with fixed timelines must adapt strategy to current conditions regardless of whether timing is optimal.
Buyer evaluation questions:
- How does my price range compare to current activity?
- What timeline flexibility do I have?
- How should current data affect my offer approach?
- What competition level exists in my target areas?
- How can I prepare to act decisively when finding the right property?
Q: How can buyers research specific neighborhood conditions?
A: Monitor days on market for listings in target neighborhoods. Review recent sales to understand typical transaction dynamics. Ask representation about current showing activity and offer situations. Work with experienced representation who can provide real-time intelligence about specific area conditions beyond citywide statistics.
What Questions Should Sellers Ask When Evaluating Current Conditions?
Sellers benefit from asking specific questions revealing how current data affects their strategy. Systematic evaluation helps develop effective positioning.
Assess how your property compares to recent sales in your immediate area. Understanding where your home fits within current market activity helps establish realistic pricing and timeline expectations. Properties comparable to those actively selling should expect similar market reception.
Evaluate your timeline requirements and how they affect available options. Sellers with flexibility can optimize timing. Those needing to sell within specific periods must position properties competitively for current conditions.
Seller evaluation questions:
- How does my property compare to recent comparable sales?
- What timeline constraints affect my strategy options?
- How should current data inform my pricing approach?
- What buyer profiles are active in my price segment?
- What preparation would enhance competitive positioning?
Q: How should sellers evaluate their competitive position?
A: Request comparative market analysis examining recent sales of similar properties in your immediate area. Understand how your home's condition, features, and pricing compare to properties that recently sold. Identify what differentiates your property positively or negatively relative to competitors. Professional analysis helps calibrate realistic positioning.
How Does Data-Driven Strategy Benefit Both Buyers and Sellers?
Understanding why current data matters helps both audiences appreciate the value of informed decision-making. Strategy based on evidence outperforms assumption-based approaches.
Buyers using current data can calibrate expectations realistically, develop competitive offer strategies, and recognize opportunities that assumption-based buyers may miss. Understanding actual market dynamics prevents both overpaying from uninformed urgency and missing opportunities from outdated caution.
Sellers using current data can position properties competitively, set realistic timeline expectations, and avoid extended marketing periods that result from aspirational pricing. Understanding buyer behavior and market activity enables strategies that optimize outcomes rather than creating frustration.
Data-driven strategy benefits:
- Realistic expectations from evidence
- Competitive positioning from market understanding
- Opportunity recognition from current awareness
- Frustration prevention from realistic planning
- Outcome optimization from informed decisions
Q: How often should buyers and sellers review market data?
A: Weekly data review provides optimal balance between staying current and avoiding overreaction to short-term fluctuations. Significant strategy changes should consider multiple weeks of data rather than single-week variations. Work with representation who monitors data consistently and can contextualize trends within longer-term patterns.
How Do San Antonio Submarkets Vary Within Overall Trends?
Understanding that citywide data masks submarket variation helps both buyers and sellers focus appropriately. Different areas behave differently within overall patterns.
San Antonio encompasses diverse submarkets from Schertz and Cibolo in the northeast to Helotes in the northwest to Boerne in the Hill Country. Each area has distinct buyer profiles, pricing patterns, and market dynamics that may differ from citywide averages.
Buyers should focus on data specific to target neighborhoods rather than applying citywide statistics universally. Sellers should understand competitive conditions in their specific markets rather than assuming overall trends apply uniformly.
Submarket variation considerations:
- Different areas showing different patterns
- Neighborhood-specific data more relevant than averages
- Buyer profiles varying by area
- Pricing dynamics differing across submarkets
- Local expertise essential for accurate assessment
Q: How can buyers and sellers access submarket-specific data?
A: Work with representation who monitors specific areas rather than relying only on overall market reports. Request comparable sales analysis for specific neighborhoods. Understand how target areas compare to citywide patterns. Local market expertise provides context that broad statistics cannot capture.
What Does This Data Suggest About 2026 Market Direction?
While current data provides snapshot rather than prediction, patterns offer context for evaluating near-term expectations. Both buyers and sellers benefit from understanding what recent trends may indicate.
Consistent transaction volume through holiday transition suggests market stability continuing into 2026. The maintained buyer engagement indicates demand supporting current activity levels. Neither dramatic acceleration nor concerning deterioration characterized the year-end transition.
Pricing patterns reflecting seasonal sales mix changes rather than value shifts suggest underlying stability. Markets functioning normally through calendar transitions provide foundation for planning based on typical seasonal patterns.
2026 outlook context:
- Volume consistency suggesting market stability
- Buyer engagement indicating sustained demand
- Pricing reflecting sales mix rather than value changes
- Normal seasonal function providing planning foundation
- Stable conditions likely continuing near-term
Q: Should buyers or sellers expect significant market changes in 2026?
A: Current data does not suggest imminent significant changes. Markets appear to be functioning normally with expected seasonal patterns. Both buyers and sellers should plan for relatively stable conditions while remaining attentive to broader economic factors that could affect housing markets. Base near-term decisions on current conditions while monitoring developments.
Expert Insight from Tami Price
"Weekly sales data provides the real-time market intelligence that monthly reports cannot match," says Tami Price, REALTOR® and Broker Associate with Real Broker, LLC. "The holiday transition data shows a market functioning consistently, with buyer engagement maintained through year-end and transaction volume remaining strong into January. Both buyers and sellers can approach 2026 with confidence in market functionality."
Price brings nearly two decades of experience and approximately 1,000 closed transactions to her work with buyers and sellers throughout San Antonio, Schertz, Cibolo, Helotes, Converse, and Boerne. Her data-driven approach helps clients on both sides of transactions develop strategies aligned with current market realities.
"For buyers, the consistent volume means opportunity exists when you are prepared to act," Price explains. "More than 400 homes selling weekly indicates choices across neighborhoods and price ranges. Buyers who understand current conditions can compete effectively when finding properties matching their goals."
Her recognition as a RealTrends Verified Top Agent and 14-time Five Star Professional Award Winner with more than 650 five-star reviews and recommendations reflects consistent client satisfaction serving buyers and sellers navigating San Antonio market conditions.
"For sellers, the data confirms that appropriately positioned properties continue selling regardless of calendar timing," Price notes. "The key is understanding where your home fits within current market activity and positioning competitively. Preparation and realistic pricing matter more than trying to time seasonal peaks perfectly."
Three Key Takeaways
1. San Antonio Transaction Volume Remained Consistent Through Holiday Transition, Demonstrating Market Stability for Both Buyers and Sellers
More than 470 homes sold in both the pre-holiday and post-holiday weeks measured, indicating buyer engagement maintained through year-end transition. For buyers evaluating homes for sale in San Antonio, this consistency confirms active market with genuine opportunity. For those selling a home in San Antonio, it validates that buyer demand exists for appropriately positioned properties.
2. Pricing Patterns Reflect Seasonal Sales Mix Changes Rather Than Market Deterioration
The shift from $350,000 median in mid-December to $309,990 in early January reflects typical early-year patterns where moderate price ranges represent larger transaction share. Both buyers and sellers should interpret segment-specific data rather than assuming overall averages apply to their situations.
3. Weekly Data Provides Strategic Advantage for Both Buyers and Sellers Developing Evidence-Based Approaches
Understanding current market dynamics enables realistic expectations, competitive positioning, and outcome optimization. Working with experienced representation like Tami Price, recognized as one of the best real estate agents in San Antonio, helps translate market data into actionable strategy aligned with individual circumstances.
Frequently Asked Questions
Q: How many homes sold in San Antonio during the holiday transition?
A: The pre-holiday week of December 15-21, 2025 recorded 472 sales. The post-holiday week of December 29, 2025 through January 4, 2026 recorded 473 sales, demonstrating consistent buyer engagement through the transition.
Q: What were San Antonio home prices during this period?
A: Mid-December showed median of $350,000 and average of $416,980. Early January showed median of $309,990 and average of $377,186. The differences reflect seasonal sales mix changes typical for this transition period.
Q: Is early January a good time to buy in San Antonio?
A: Early January can offer advantages including reduced competition, potential seller flexibility, and strong activity in moderate price ranges. Evaluate whether these advantages align with your search criteria and timeline.
Q: Is early January a good time to sell in San Antonio?
A: Properties sold consistently through the holiday transition when positioned appropriately. Early listing may capture buyer attention before spring inventory increases. Evaluate whether your property competes effectively in current conditions.
Q: What does consistent volume indicate about market health?
A: Consistent transaction volume through seasonal transitions indicates functioning market with genuine demand. This stability provides confidence foundation for both buyers and sellers planning housing decisions.
Q: Does Tami Price monitor weekly market data?
A: Yes. Tami Price reviews LERA MLS data weekly to provide clients with current market intelligence that informs strategy development. This data-driven approach helps both buyers and sellers make informed decisions.
Q: How do I start working with Tami Price?
A: Book a consultation to discuss your situation, whether buying or selling. Understanding your circumstances enables personalized guidance through the home buying process or selling strategy development.
Q: Where can I search current San Antonio listings?
A: Search current homes for sale in San Antonio through TamiPrice.com, with options to filter by location, price, and property characteristics.
The Bottom Line
San Antonio housing market data from the holiday transition demonstrates consistent activity and stable conditions entering 2026. Transaction volume maintained through year-end indicates buyer engagement supporting current market function. Pricing patterns reflect typical seasonal sales mix rather than concerning shifts in underlying values.
Both buyers and sellers benefit from understanding how current data informs their specific situations. Buyers can approach active markets with confidence when prepared to compete effectively. Sellers can position properties knowing that market demand exists for appropriately priced homes across seasonal periods.
Weekly data provides strategic advantage that monthly reports cannot match. Understanding current conditions enables realistic expectations and informed decision-making that optimizes outcomes for both audiences.

Contact Tami Price, REALTOR®
Whether evaluating current market conditions for purchase timing, developing 2026 selling strategy, or seeking to understand how San Antonio trends affect your specific situation, working with an experienced REALTOR® provides guidance translating data into effective action. Tami Price brings local market knowledge and data-driven expertise to help clients make informed housing decisions.
From buyers seeking competitive advantage to sellers positioning for market success, personalized service makes the difference in successful transactions.
Tami Price, REALTOR®, Broker Associate
📞 210-620-6681
Tami Price's Specialties
- Comprehensive Buyer and Seller Representation
- Military Relocations and PCS Moves
- VA Loan Guidance and Assumptions
- New Construction Navigation
- Strategic Pricing and Market Analysis
- Professional Property Marketing
- First-Time Buyer Education
- Move-Up and Downsizing Transitions
- Residential Real Estate Throughout San Antonio, Schertz, Cibolo, Helotes, Converse, and Boerne
Disclaimer
This blog post is provided for informational purposes only and should not be construed as guarantees regarding property values, market conditions, or transaction outcomes. Market data reflects LERA MLS information for specific periods noted and is subject to revision. Past market performance does not predict future results. Real estate markets are influenced by numerous factors including economic conditions, interest rates, inventory levels, and buyer behavior that can change rapidly. Real estate decisions should be based on individual circumstances, professional guidance, and current market conditions. Tami Price, REALTOR®, and Real Broker, LLC make no warranties regarding accuracy, completeness, or applicability of information to specific circumstances.
Categories
- All Blogs (926)
- Home Buying (13)
- Neighborhood Guides (44)
- 10 Incentive and Rate Buydown Questions (1)
- 10 Military Neighborhood (1)
- 10 Mistakes Sellers Make (1)
- 10 Strategies to Coordinate a Same Day Close (1)
- 12 Lifestyle Questions to Move In (1)
- 12 PCS What Ifs (1)
- 12 Photos and Marketing Assets (1)
- 13 PCS Hunting Trip Tips (1)
- 15 Red Flags Touring Home in San Antonio (1)
- 2026 Market (1)
- 30 days after closing your home (1)
- 7 Offer Terms Beyond Price (1)
- 7 VA Specific Questions (1)
- 78015 Ranked One (1)
- 8 Bridge (1)
- 8 Myths Buyers Believe about Down Payments (1)
- 8 Reasons VA Buyers Love New Construction (1)
- 9 Mistakes Move Up Buyers Make (1)
- 9 Questions to Decide If You Keep Your PCS Home (1)
- 9 Timeline Questions Every Buyer Need to Ask (1)
- 9 Warranty Questions to Ask (1)
- 9 Ways to Attract VA & Military Buyers (1)
- About Tami Price (6)
- Affordable Communities (2)
- Affordable Housing & Community Development (5)
- Agent Qualifications and Credentials (1)
- Agent Qualifications and Experience (1)
- Agent Recognition (3)
- Agent Selection (1)
- AI and Real Estate Tools (1)
- Alamo Heights (5)
- Alamo Heights ISD (1)
- Alamo Heights Real Estate (1)
- Alamo Ranch (2)
- Amenities in Helotes, Texas (3)
- Apartment Market (1)
- Appraisals (1)
- Arts and Culture (1)
- Awards and Recognition (7)
- Balcones Creek (1)
- Best Neighborhoods to Live in Cibolo, TX (3)
- Best Neighborhoods to Live in San Antonio (16)
- Best Places to Live in Leon Valley: A Neighborhood Guide (1)
- Best Places to Live in Northeast Inner Loop: A Neighborhood Guide (1)
- Bexar County Property Tax (1)
- Bexar County Real Estate (3)
- Boerne Home Sellers (1)
- Boerne Neighborhoods (2)
- Boerne Texas (9)
- Broadway Corridor Development (1)
- Build-to-Rent Communities (1)
- Builder Contracts & Warranties (3)
- Builder Incentives (1)
- Builder Warranties (1)
- Buyer (97)
- Buyer Activity San Antonio (1)
- Buyer and Seller Guidance (4)
- Buyer Due Diligence (1)
- Buyer Education (46)
- Buyer Guide (9)
- Buyer Guides (7)
- Buyer Protection Strategies (1)
- Buyer Representation (1)
- Buyer Representation Expertise (1)
- Buyer Resources (87)
- Buyer Strategy (2)
- Buyers (13)
- Buyers Agent (1)
- Buying a Foreclosed Home in San Antonio (10)
- Buying a Home (2)
- Buying a Home in San Antonio (6)
- Buying Timeline (1)
- Buying vs Renting (1)
- Castroville, TX (8)
- Central San Antonio (1)
- Central San Antonio Development (2)
- Central Texas Growth (1)
- Choosing a Real Estate Agent (1)
- Choosing an Agent (1)
- Cibolo Communities (1)
- Cibolo Home Sellers (1)
- Cibolo TX (15)
- Client Reviews and Testimonials (1)
- Client Satisfaction (1)
- Client Stories (1)
- Client Testimonial (4)
- Clients review (4)
- Cobblestone (1)
- Comal County (1)
- Commercial & Retail Development (27)
- Commercial Development (13)
- Commercial Development Impact on Home Values (1)
- Commercial Real Estate (1)
- Community (1)
- Community Amenities (2)
- Community Development (23)
- Community Development and Real Estate (3)
- Community Events & Development (1)
- Community Infrastructure (1)
- Community Investment Impact (2)
- Community Landmarks (1)
- Community News (4)
- Community Planning (2)
- Community Revitalization (1)
- Community Spotlights (1)
- Commuter Neighborhoods (1)
- Cons of Living in Helotes, TX (4)
- Conservation Communities (1)
- Contingency Questions (1)
- Converse Home Sellers (1)
- Converse Homes For Sale (3)
- Converse Real Estate (1)
- Converse TX (10)
- Converse TX Real Estate (1)
- Cost of Living Guides (1)
- Cost of Living in San Antonio TX (25)
- CPS Energy Programs (1)
- Custom Homes (5)
- Davis Ranch (1)
- Days on Market (1)
- Deco District San Antonio (1)
- Denver Heights (1)
- Down Payment Assistance (1)
- Downtown Boerne (1)
- Downtown Development (3)
- Downtown Living (1)
- Downtown Revitalization (14)
- Downtown San Antonio (2)
- Downtown San Antonio Real Estate (5)
- Downtown San Antonio Revitalization (1)
- East Side Living (1)
- East Side Neighborhoods (1)
- East Side San Antonio (4)
- Economic Development (3)
- Economic Growth & Industry (1)
- Education, Texas Hill Country (1)
- Emerald Pointe (1)
- Employment (1)
- Employment Corridors (1)
- Encino Forest (1)
- Entertainment Economy (1)
- Equity and Pricing Strategy (2)
- Equity Q&A (1)
- Established Communities (3)
- Events in San Antonio (207)
- Expert Advice from Tami Price, Realtor® (10)
- Fair Oak Ranch (1)
- Family Activities (2)
- Family Homes (3)
- Family Living in San Antonio (1)
- FAQ (1)
- Far Northwest San Antonio (1)
- Far West San Antonio (1)
- Far Westside Real Estate (4)
- Fastest Growing Zip Codes in America (1)
- Featured Homes for Sale (2)
- Featured Properties (1)
- Financial Planning (10)
- Financing Strategy (1)
- First Time Buyers (23)
- First Time Sellers (1)
- First-Time Buyers (6)
- First-Time Homebuyer Resources (4)
- First-Time Homebuyer Tips (2)
- First-Time Homebuyers (6)
- First-Time Investors (1)
- Fort Sam Houston (3)
- Fort Sam Houston Real Estate (1)
- Fort Sam Houston, TX (2)
- Fox Grove (1)
- FSBO vs Agent Representation (1)
- Gated Communities (5)
- Golf Communities (1)
- Great Northwest (1)
- Greater San Antonio Housing Trends (2)
- Greater San Antonio Real Estate (5)
- Green Home Upgrades (1)
- Growth and Development (11)
- Healthcare (1)
- HELOC (1)
- Helotes Home Sellers (1)
- Highway 151 Corridor Growth (1)
- Hill Country Business (1)
- Hill Country Communities (2)
- Hill Country Development (3)
- Hill Country Homes for Sale (1)
- Hill Country Living (3)
- Hill Country Market Updates (1)
- Hill Country Real Estate (4)
- Historic Districts (5)
- Historic Neighborhoods (4)
- Historic Preservation (2)
- Holiday Attractions (1)
- Holiday Guide (1)
- Home Buying (7)
- Home Buying Education (3)
- Home Buying Guide (7)
- Home Buying Process (8)
- Home Buying Strategy (2)
- Home Buying Tips (6)
- Home Energy Efficiency San Antonio (4)
- Home Financing (2)
- Home Improvement ROI (1)
- Home Inspections (1)
- Home Preparation (2)
- Home Pricing Strategy (13)
- Home Renovation for Resale (1)
- Home Selling (9)
- Home Selling Guide (10)
- Home Selling Strategies (3)
- Home Selling Strategy (3)
- Home Selling Tips (22)
- Home Staging and Updates (2)
- Home Values (2)
- Homebuyer Education (15)
- Homebuyer Resources (1)
- Homebuying Guide (1)
- Homebuying Tips (3)
- Homeowner (35)
- Homeowner Tax Benefits (1)
- Homeownership Costs (1)
- Homes for Sale (2)
- Homes for sale near Lackland AFB (4)
- Homes Near Military Bases (1)
- Homestead amenities (1)
- Horizon Pointe (1)
- House Hunting Guide (1)
- Housing (1)
- Housing Community Development (1)
- Housing Development (2)
- Housing Market Updates (3)
- How to Buy a House in San Antonio TX (48)
- Huebner Oaks shopping center (1)
- Hunters Ranch (1)
- Hybrid (1)
- I-10 Corridor (1)
- I-35 Corridor (1)
- In Person (1)
- Incorporated Cities (6)
- Industrial Investment Impact (1)
- Industry News (2)
- Industry Recognition (1)
- Infrastructure & Growth Projects (26)
- Infrastructure and Sustainability (1)
- Infrastructure Development (1)
- Infrastructure Investment (1)
- Infrastructure Updates (2)
- Interest Rates (2)
- Invest in San Antonio (46)
- Investment Opportunities (2)
- Investment Property San Antonio (4)
- JBSA (9)
- JBSA Housing (11)
- JBSA Real Estate (4)
- JBSA Resources (7)
- Joint Base San Antonio (5)
- Joint Base San Antonio Housing (1)
- Judson ISD (2)
- Kendall County (1)
- La Cantera Retail Development (1)
- Lackland AFB (7)
- Lackland AFB Housing (1)
- Land Conservation (1)
- Land Use Planning (1)
- Lera MLS (14)
- Lifestyle & Community Growth (18)
- Lifestyle & Local Growth (12)
- Lifestyle Amenities (1)
- Lifestyle Communities (1)
- Listing Preparation (1)
- Listing Strategy (1)
- Live Oak (1)
- Living in San Antonio, TX (52)
- Living Near Randolph AFB (7)
- Loan Programs (1)
- Local Attractions (3)
- Local Business (1)
- Local Business & Development (9)
- Local Business & Economy (3)
- Local Business Spotlight (20)
- Local Business Support (5)
- Local Development (4)
- Local Development News (9)
- Local Market Insights (5)
- Local News (2)
- Local News Around San Antonio (2)
- Local Policy Changes (1)
- Local Real Estate News (1)
- Loop 1604 Corridor Growth (2)
- Loop 410 Corridor Development (1)
- Luxury Communities (3)
- Luxury Homes (2)
- Luxury Real Estate (1)
- Luxury Retail San Antonio (1)
- MacArthur Park (1)
- Major Developments (2)
- Making Offers on Homes (1)
- Market Analysis (26)
- Market Conditions (47)
- Market Expertise (1)
- Market Insights (5)
- Market Strategy (1)
- Market Timing (2)
- Market Trends (10)
- Market Trends & Insights (2)
- Market Update (16)
- Market Update 2026 (1)
- Market Updates (21)
- Master Planned Communities (12)
- Medical Center Area Real Estate (1)
- Medina Valley ISD (2)
- Midtown Living (1)
- Military & Economic Impact (3)
- Military Buyers (3)
- Military Communities (1)
- Military Families (1)
- Military Family Resources (1)
- Military Heritage (1)
- Military Homebuying (3)
- Military Homeownership (1)
- Military Housing (3)
- Military Housing Market in Texas (16)
- Military Life in San Antonio (2)
- Military Neighborhoods (1)
- Military PCS Relocations (3)
- Military Real Estate (2)
- Military Relocation (95)
- Military Relocation & VA Loans (10)
- Military Relocation San Antonio (4)
- Military Relocation Services (3)
- Military Relocation to San Antonio (50)
- Military Relocations (19)
- Military Relocations & VA Home Loans (5)
- Mixed-Income Housing (1)
- MLS Accuracy & Data Transparency (1)
- Mortgage Programs (1)
- Mothers Day in San Antonio (1)
- Move to Boerne TX (18)
- Move to Castroville TX (11)
- Move to Converse TX (16)
- Move to New Braunfels (1)
- Move to North San Antonio (19)
- Move to San Antonio TX (73)
- Move to Selma TX (19)
- Move to Shertz TX (13)
- Move to Texas (53)
- Move Up Buyer Resources (1)
- Move Up Buyers (20)
- Move-In Ready Homes (3)
- Move-In Ready Homes San Antonio (2)
- Move-Up Buyers (2)
- Moving to Helotes, TX (17)
- Moving to San Antonio (69)
- MUD Taxes (1)
- Natalia Homes For Sale (1)
- Near East Side Living (1)
- Negotiation Strategy (2)
- Neighborhood Amenities (1)
- Neighborhood Development (1)
- Neighborhood Guides (7)
- Neighborhood Investment (1)
- Neighborhood News (2)
- Neighborhood Revitalization (2)
- Neighborhood Spotlights (12)
- Neighborhood Updates (1)
- Neighborhoods near Randolph AFB (12)
- New Braunfels (6)
- New Braunfels Homes For Sale (1)
- New Braunfels News (3)
- New Braunfels Real Estate (3)
- New Businesses (2)
- New Construction (58)
- New Construction Communities (1)
- New Construction Homes (13)
- New Construction Homes San Antonio (5)
- New Construction vs Resale (1)
- New Construction Without Customization (1)
- New Construction Without the Wait (1)
- New Contruction Cost (1)
- New Development (3)
- New Listing (19)
- New Restaurants (3)
- News (211)
- News & updates (213)
- No HOA Homes (1)
- North Central San Antonio (5)
- North East ISD (4)
- North San Antonio (9)
- North San Antonio Real Estate (3)
- North Side Neighborhoods (1)
- North Side San Antonio Development (2)
- Northeast Inner Loop (1)
- Northeast Inner Loop Neighborhoods (1)
- Northeast San Antonio (3)
- Northside ISD (5)
- Northwest San Antonio (9)
- Northwest San Antonio Development (1)
- Northwest San Antonio Growth (1)
- Northwest San Antonio Real Estate (3)
- Northwood (1)
- Olympia Hills (1)
- One-Story Homes (1)
- Outdoor Living (1)
- Parks and Recreation (2)
- PCS and JBSA (2)
- PCS Guide (3)
- PCS Moves (12)
- PCS Moves to Joint Base San Antonio (4)
- PCS Planning (15)
- PCS Randolph AFB (17)
- PCS Relocation (1)
- PCS Resources (6)
- PCS San Antonio (46)
- PCS to San Antonio (42)
- Pearl District Area Real Estate (2)
- PID Assessments (1)
- Pinon Creek (1)
- Pipe Creek (1)
- Places to Eat Near Randolph AFB (1)
- Pool Homes (1)
- Pre Approval (1)
- Pre-Listing Preparation (2)
- Pre-Listing Process (1)
- Prescott Oaks (1)
- Pricing and Marketing Strategy (3)
- Professional Awards and Achievements (2)
- Professional Real Estate Representation (1)
- Property Tax Exemptions Texas (1)
- Property Value Enhancement (1)
- pros and cons living in Converse TX (3)
- Pros and Cons Living in Selma TX (6)
- Pros and Cons of Living in Castroville, TX (4)
- Pros and Cons of Living in San Antonio (33)
- PT500 List (1)
- Purchase Negotiation (1)
- Quality of Life (1)
- Quick Close Real Estate (1)
- Randolph AFB Neighborhoods (2)
- Real Estate (1)
- Real Estate Advice (1)
- Real Estate Agent Recognition (6)
- Real Estate Agent Selection (2)
- Real Estate Agent Value (1)
- Real Estate Consultation (1)
- Real Estate Finance (1)
- Real Estate Financing (1)
- Real Estate Impact (1)
- Real Estate Investment San Antonio (2)
- Real Estate Legal Issues (1)
- Real Estate Market Insights (2)
- Real Estate Market Trends (5)
- Real Estate Professional Designations (1)
- Real Estate Strategy (1)
- Real Estate Technology & Trends (2)
- Real Estate Tips (1)
- Real Estate Tips and Guides (2)
- Real Estate Trends (4)
- RealTrends Verified (1)
- Regional Development (1)
- Regional Real Estate (2)
- Relocating to San Antonio (2)
- Relocation (4)
- Relocation Resources (2)
- Relocation to San Antonio (55)
- Remote Homebuying (1)
- Rental Housing (1)
- Rental Property (1)
- Rental Strategy (1)
- Resale Properties (1)
- Retail Development (2)
- Retire in Boerne TX (11)
- Retire in San Antonio (37)
- Reviews and Recognition (1)
- Rockwall Ranch (1)
- Rural Living (2)
- SABOR (27)
- San Antonio Area Listings (1)
- San Antonio Business Growth (1)
- San Antonio Buyer Resources (2)
- San Antonio Communities (3)
- San Antonio Community Events (1)
- San Antonio Community News (1)
- San Antonio Data Center Development (1)
- San Antonio Development (5)
- San Antonio Development & East Side Real Estate (1)
- San Antonio Dining and Lifestyle (3)
- San Antonio East Side Development (1)
- San Antonio Employment Growth (1)
- San Antonio Food & Community Development (2)
- San Antonio Growth (8)
- San Antonio Home Buying and Selling (2)
- San Antonio Home Buying Guide (5)
- San Antonio Home Improvement (2)
- San antonio home prices (3)
- San Antonio Home Sellers (3)
- San Antonio Homeowner Guide (1)
- San Antonio Homeowner Resources (1)
- San Antonio Homes for Sale (11)
- San Antonio Housing Market (2)
- San Antonio Housing Market & Mortgage Financing (2)
- San Antonio Housing Market Analysis (2)
- San Antonio Housing Trends & Market Analysis (4)
- San Antonio Industrial Development (1)
- San Antonio Industrial Policy (1)
- San Antonio Investment Properties (2)
- San Antonio Job Market (1)
- San Antonio Lifestyle Amenities (1)
- San Antonio Listing (1)
- San Antonio Living (1)
- San Antonio Market (3)
- San Antonio Market Updates (18)
- San Antonio Military Relocation (2)
- San Antonio Neighborhoods (67)
- San Antonio New Construction & Master-Planned Communities (4)
- San Antonio New Home Communities (1)
- San Antonio News (229)
- San Antonio North Side Development (1)
- San Antonio Parks (1)
- San Antonio Property Investment (1)
- San Antonio Property Taxes (2)
- San Antonio Real Estate (150)
- San Antonio Real Estate Agents (6)
- San Antonio Real Estate Excellence (1)
- San Antonio Real Estate Guide (6)
- San Antonio Real Estate Market (41)
- San Antonio Real Estate Market Analysis (6)
- San Antonio Real Estate News (2)
- San Antonio REALTOR Awards (1)
- San Antonio Restaurant News (2)
- San Antonio Restaurant Openings (1)
- San Antonio Seller Resources (2)
- San Antonio Sellers (1)
- San Antonio Spec Homes (1)
- San Antonio Spurs Community Programs (1)
- San Antonio Suburbs (1)
- San Antonio Transportation (2)
- San Antonio University Area Housing (1)
- San Antonio Urban Living (7)
- San Antonio West Side Development (2)
- San Antonio Zoning Policy (1)
- Scenic Loop (1)
- Schertz Home Sellers (1)
- Schertz Real Estate (1)
- Schertz, TX (13)
- School Districts (1)
- School Information (1)
- SCUCISD Schools (1)
- Secured Quick Offer (1)
- Sell Home In San Antonio TX (64)
- Seller (83)
- Seller Education (24)
- Seller Guide (4)
- Seller Guides (1)
- Seller Representation Expertise (1)
- Seller Resources (66)
- Seller Should Understand (1)
- Seller Strategy (3)
- Seller Tips (2)
- Sellers (10)
- Selling A Home in San Antonio (62)
- Selling Your San Antonio Home (3)
- Selma TX (9)
- Single-Story Homes (4)
- Smart Homes (1)
- Solar Homes (2)
- South San Antonio Real Estate (1)
- South Side Economic Growth (1)
- South Side San Antonio (1)
- Southtown (2)
- Southwest San Antonio Real Estate (1)
- Spec Homes and Inventory Homes (1)
- Spurs Arena Project Marvel (1)
- Stone Oak (2)
- Stone Oak Community News (5)
- Suburban Housing Growth (12)
- Suburban Living (2)
- Talise De Culebra (1)
- Technology Growth (3)
- Technology Sector Growth (1)
- Terrell Hills (3)
- Texas Acreage Properties (3)
- Texas Homestead Exemption (1)
- The Dominion Real Estate (1)
- The Rim Area Real Estate (1)
- Things to do in San Antonio TX (21)
- Things to do Near Randolph AFB (4)
- Time Planning (1)
- Time-Sensitive Home Buying (1)
- Timing Strategy (1)
- Tips for Buying New Construction (9)
- Tobin Hill Neighborhoods (2)
- Top Real Estate Agent in San Antonio (3)
- Tourism and Economic Development (1)
- Traders's Joe San Antonio (1)
- Transaction Coordination (1)
- Transportation Infrastructure (1)
- Two-Story Homes (2)
- Universal City (1)
- Updated Homes (2)
- Upscale Communities (1)
- Urban Communities (2)
- Urban Corridor Real Estate (1)
- Urban Development (5)
- Urban Living (3)
- Urban Neighborhoods (4)
- Urban Real Estate (1)
- Urban Renewal Projects (1)
- Urban Revitalization San Antonio (1)
- Utility Cost Reduction (1)
- UTSA Campus Development (1)
- VA Buyers (1)
- VA Home Loan Benefits (3)
- VA Loan Assumptions (3)
- VA loan benefits (27)
- VA Loan Guidance (1)
- VA Loan Home Buying Assistance (2)
- VA Loans (69)
- VA Loans and Military Benefits (3)
- VA Loans and Military Home Buying (3)
- VA Loans San Antonio (43)
- VET Benefits Living in San Antonio (3)
- Veterans Resources (3)
- Village Northwest (1)
- Virtual Buyers (1)
- Walkable Communities (1)
- week in sales (39)
- Weekly Sales Report (40)
- West San Antonio (2)
- West San Antonio Development (1)
- West San Antonio Real Estate (3)
- West San Antonio Real Estate Market (2)
- West Side Infrastructure Planning (1)
- West Side Real Estate (1)
- West Side San Antonio (2)
- Windcrest Homes for Sale (1)
Recent Posts